|
|
Seismic tomography models for the Arctic Region
To detect crustal, lithospheric, core and mantle heterogeneity, various seismic tomography techniques
have been developed, depending on data availability and seismic wave types. In the Arctic region, the density
and distribution of the wave sources (earthquakes) is uneven, and most of them are located in Northeastern
Asia (on the border of Eutasian and North American tectonic plates) and along the northern segment of the
Pacific subduction zone. Therefore, methods based on the inversion of the body-waves that show better results
in areas with sufficiently dense ray paths [Thurber, 2003] are generally not suitable
for Arctic lithosphere studies.
However, methods based on shear (S-) wave inversion (chiefly based on the surface waves) are most applicable
for Arctic lithosphere and upper mantle modelling. Here we describe the main features of several segments
of S-wave tomography models covering the Circumpolar Arctic.
The SL2013sv tomography model [Schaeffer, Lebedev, 2013], based on the joint
inversion of surface and shear waves, has the best resolution to depths of 300-350 km, therefore covering
the whole lithosphere.
Also three alternative to SL2013sv models were analyzed: SEMum2 [Lekic et al., 2011], S40RTS
[Ritsema et al., 2011], downloaded via SubMachine web service [Hosseini et al., 2018],
and a composite model SMEAN2 which is a compilation of
S40RTS, GyPSuM [Simmons et al., 2010] and SAVANI [Auer et al., 2014] models.
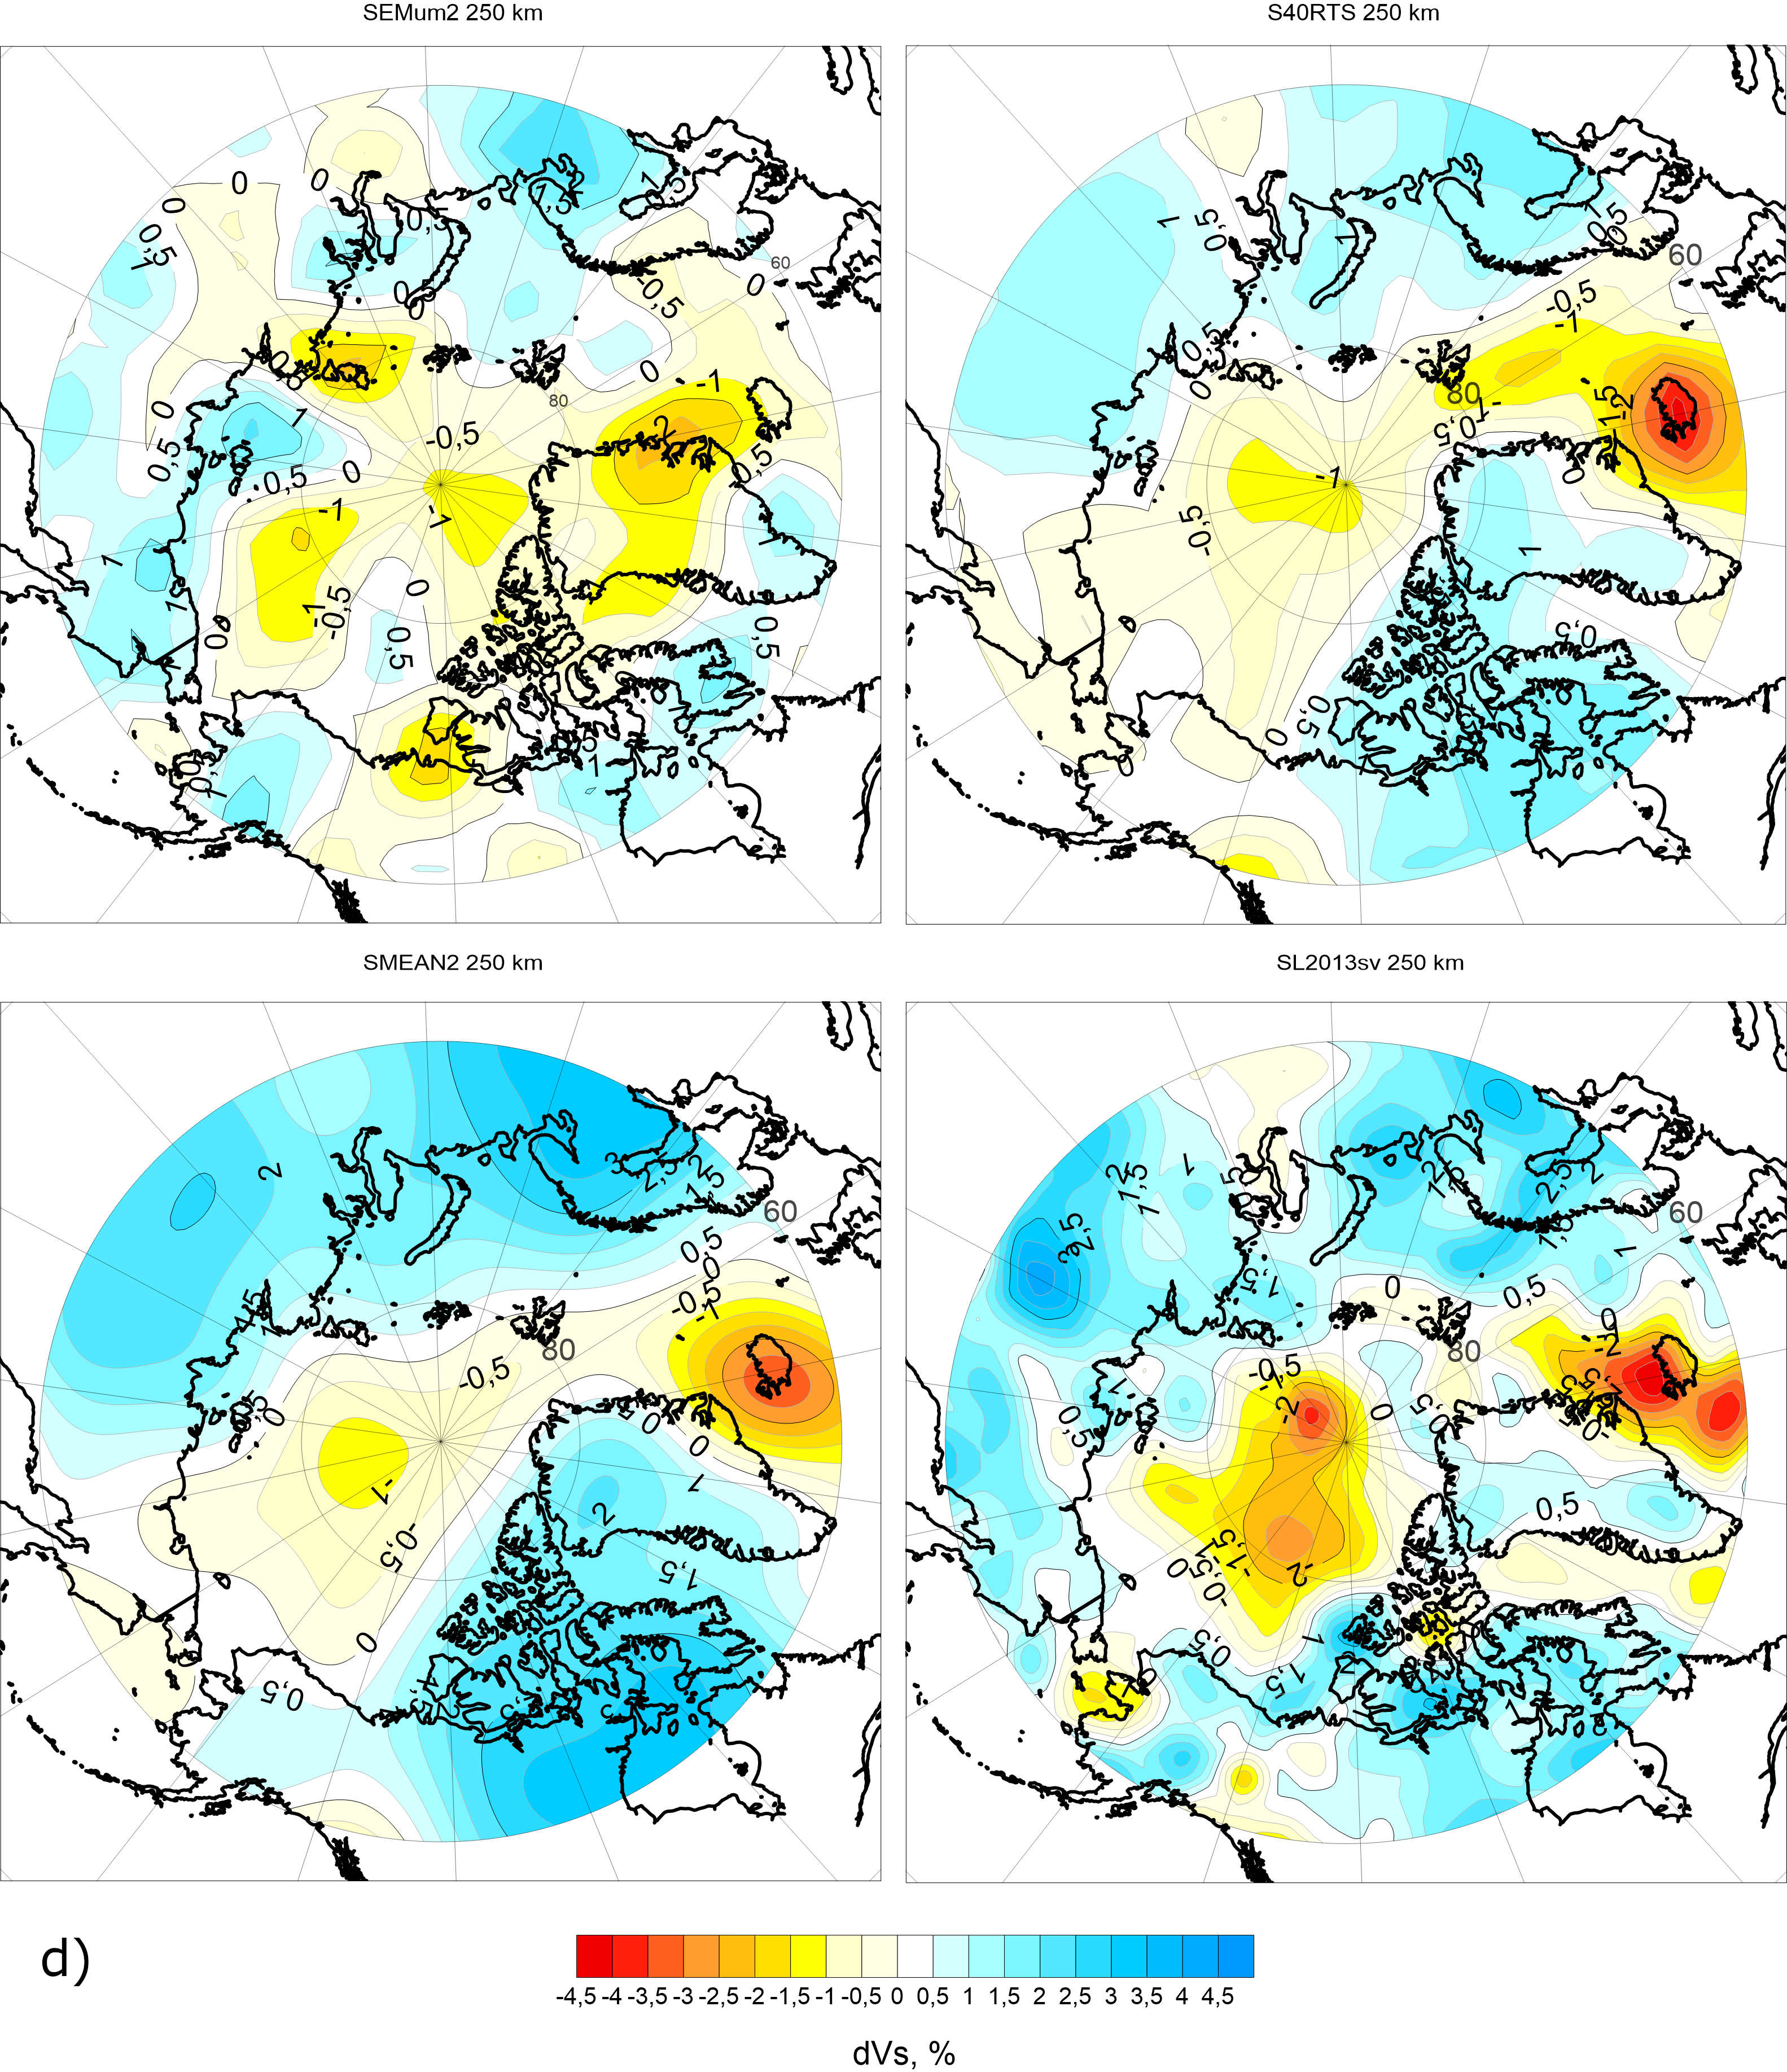
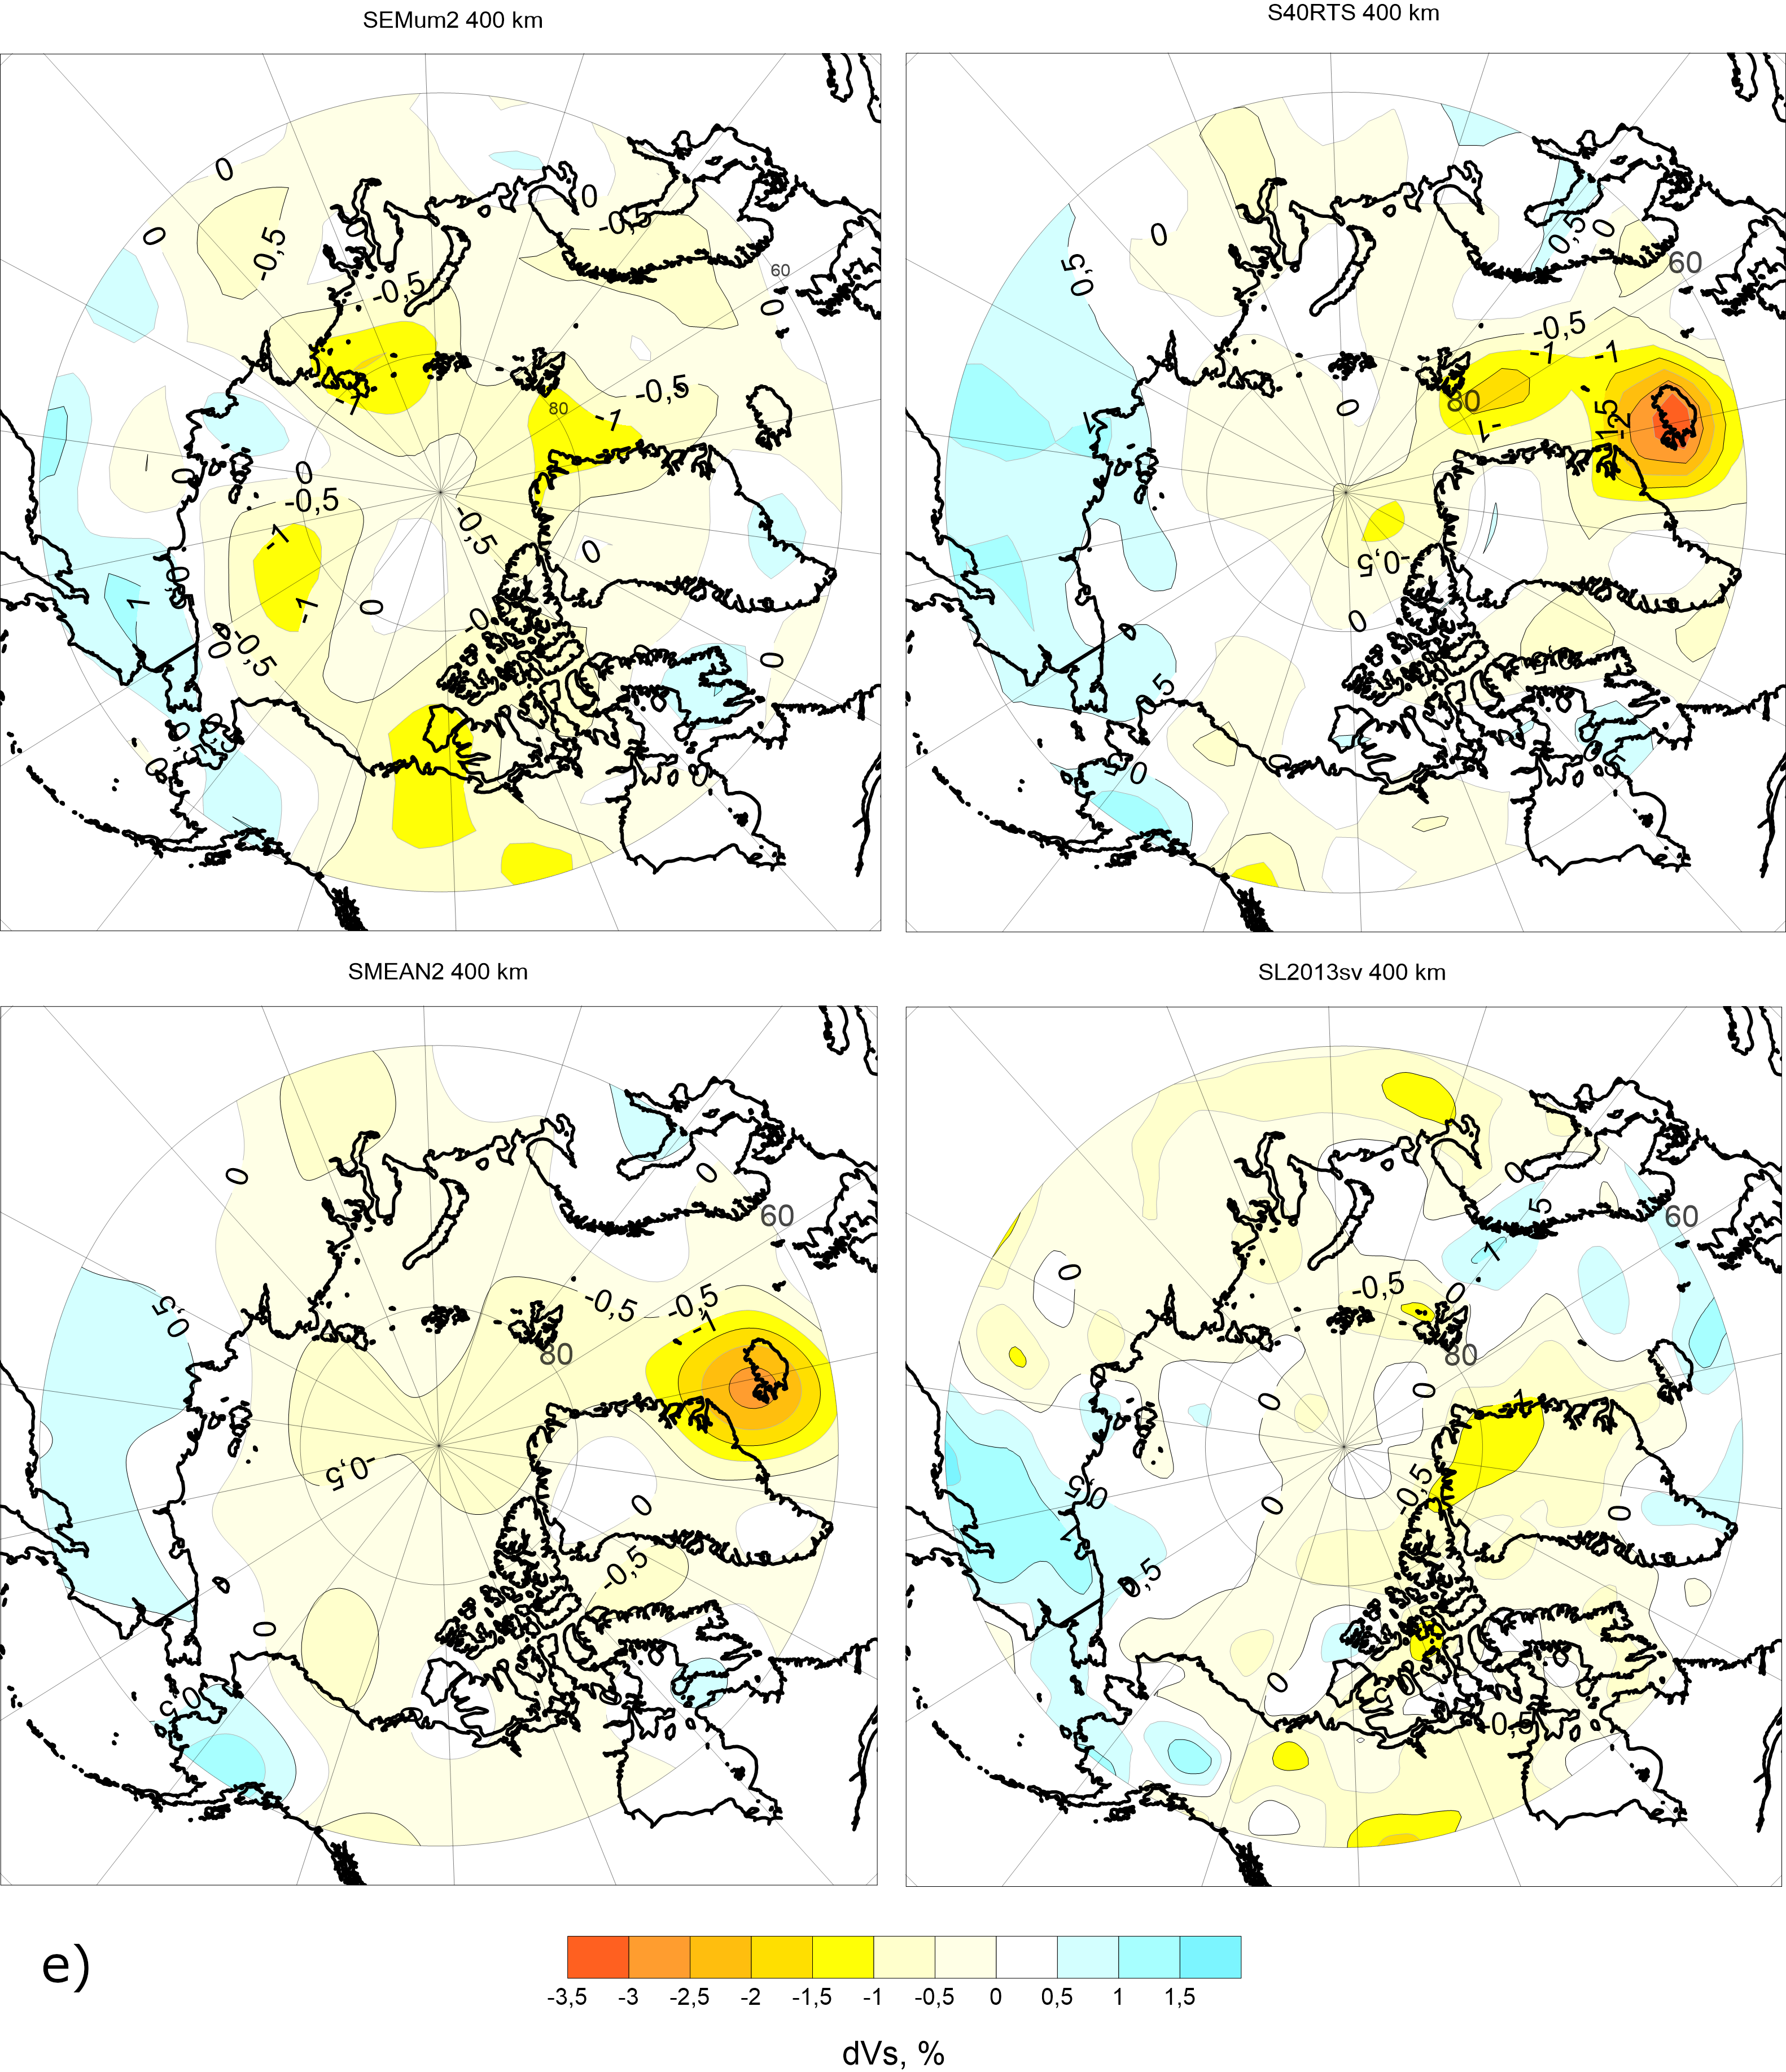
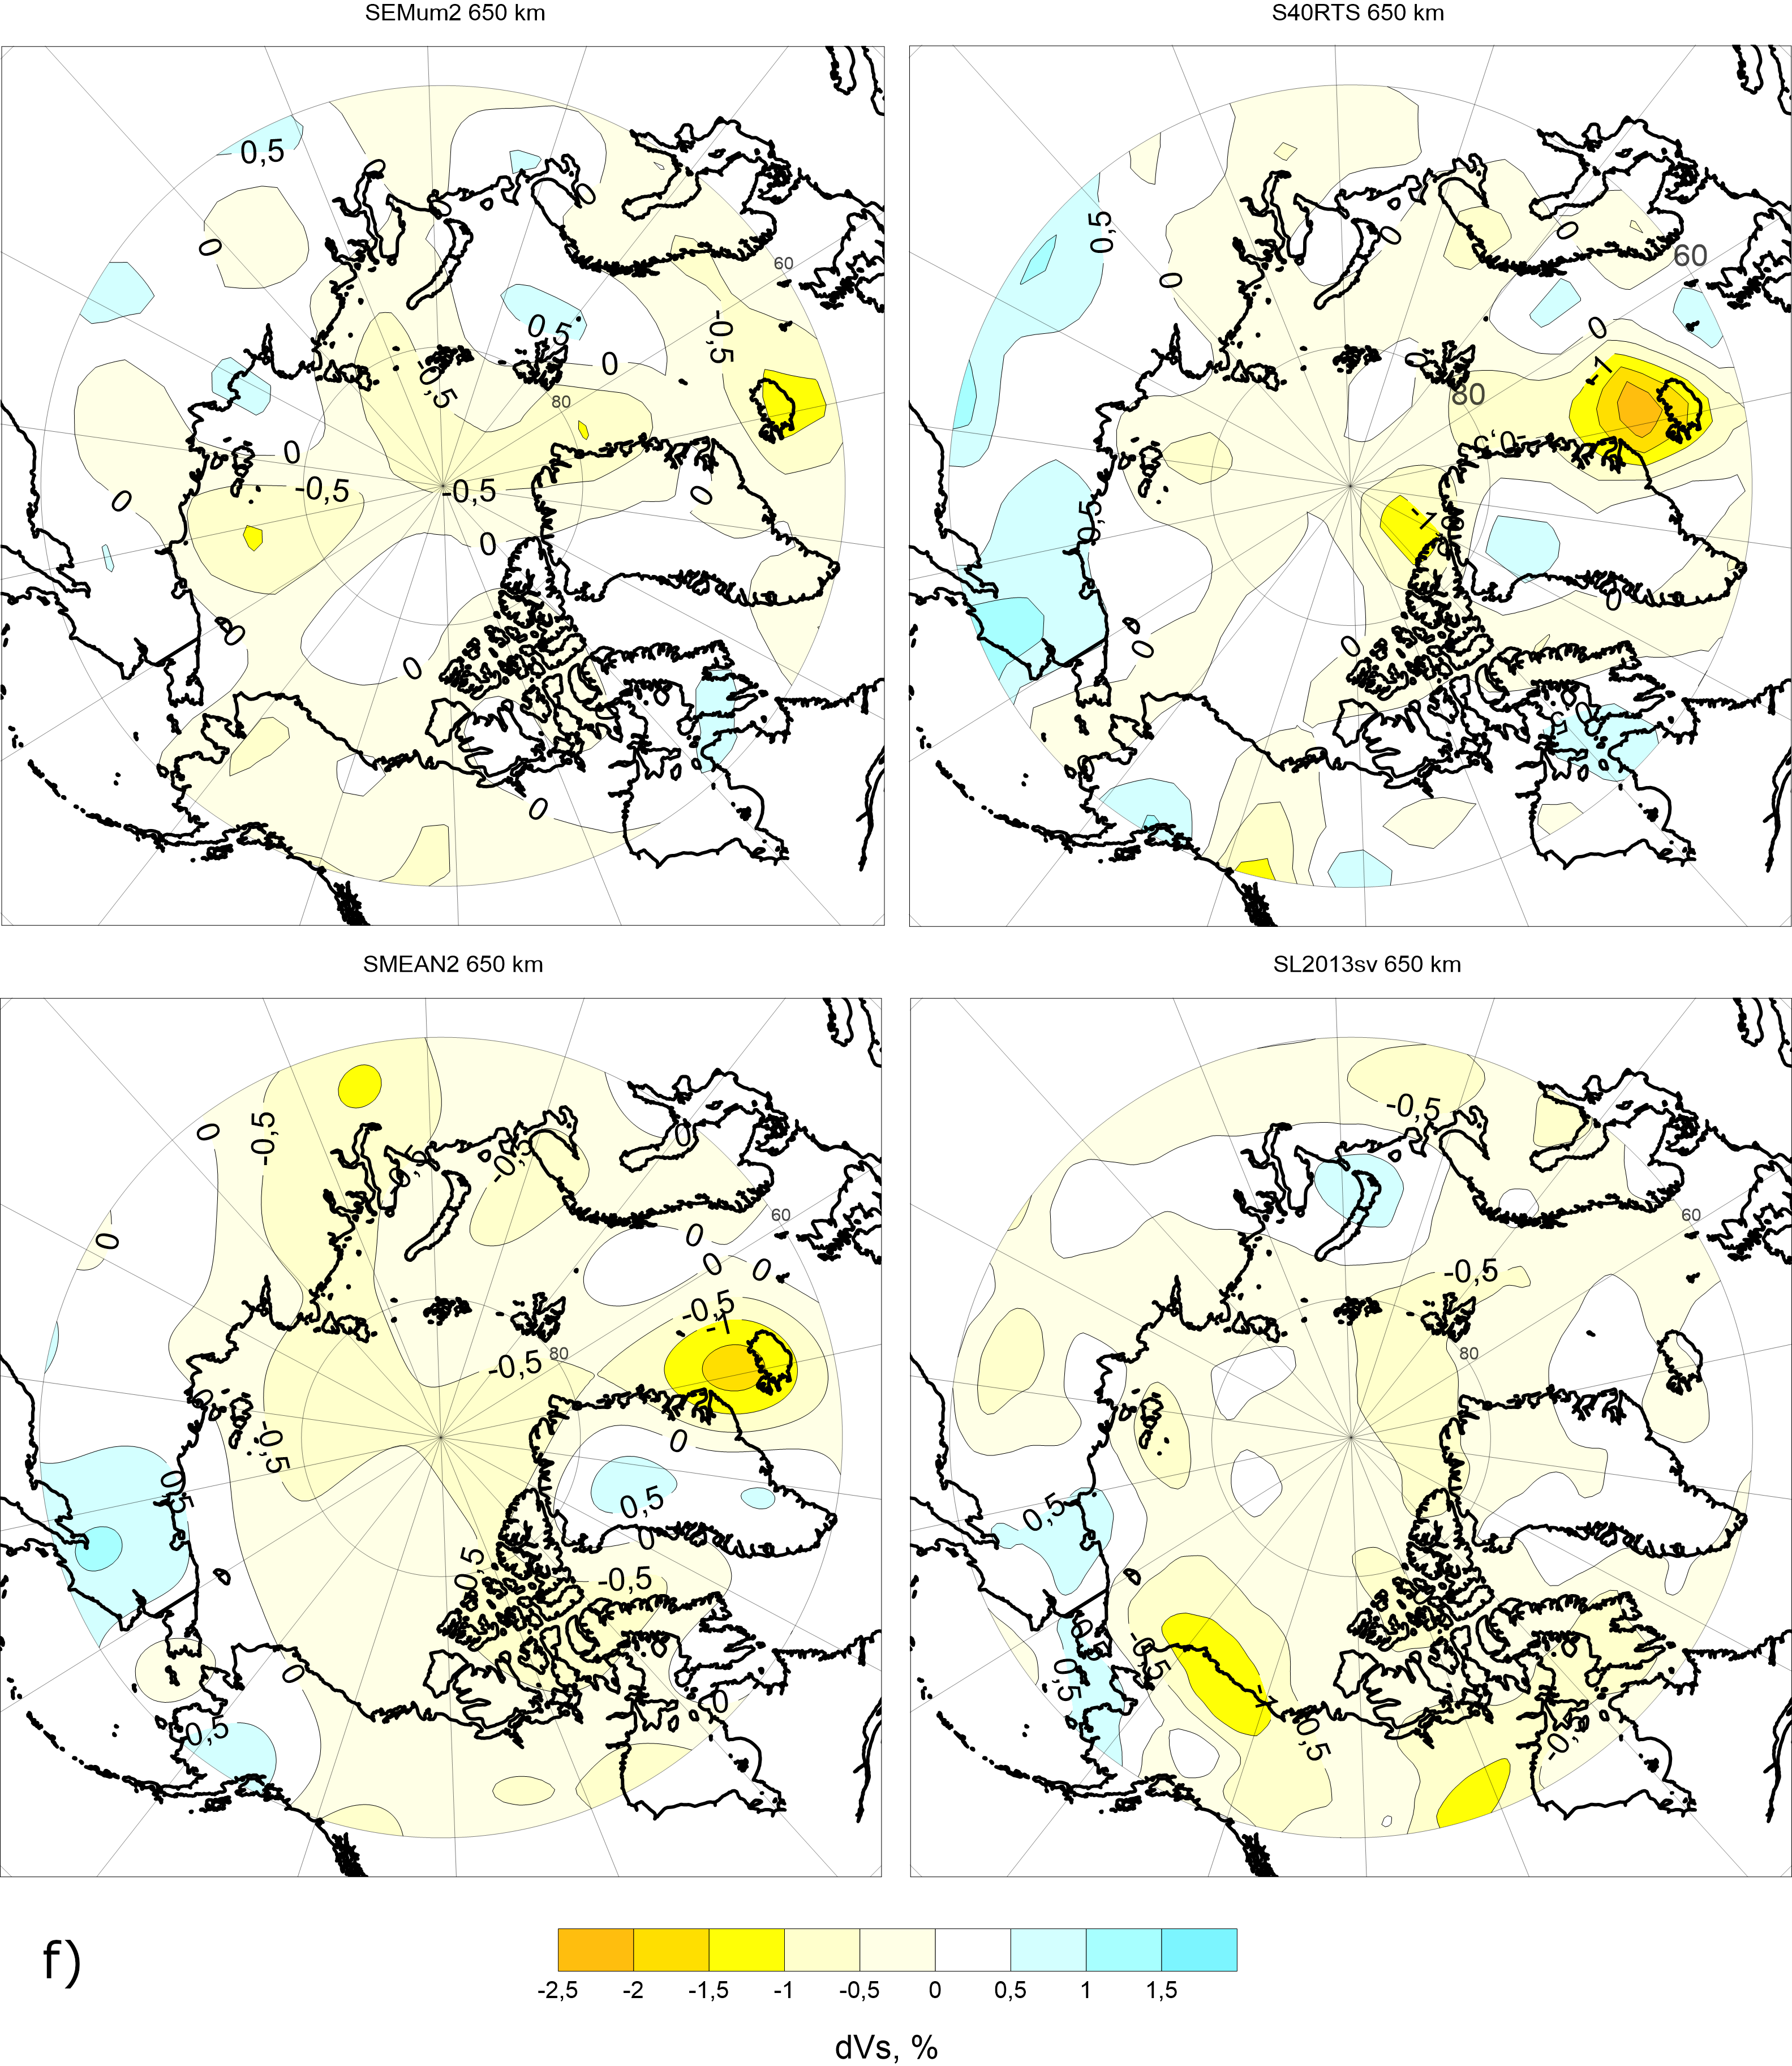
Analysis of models was done by comparison of depth slices of S-wave velocity anomalies
(dV = dVS/VS, in %) for the whole Arctic zone (from 60° N). Fig. 1 displays the slices at 50, 100, 150, 250,
400 and 650 km depth (to the average upper mantle bottom) for SEMum2, S40RTS and SMEAN2 models compared with the SL2013sv model.
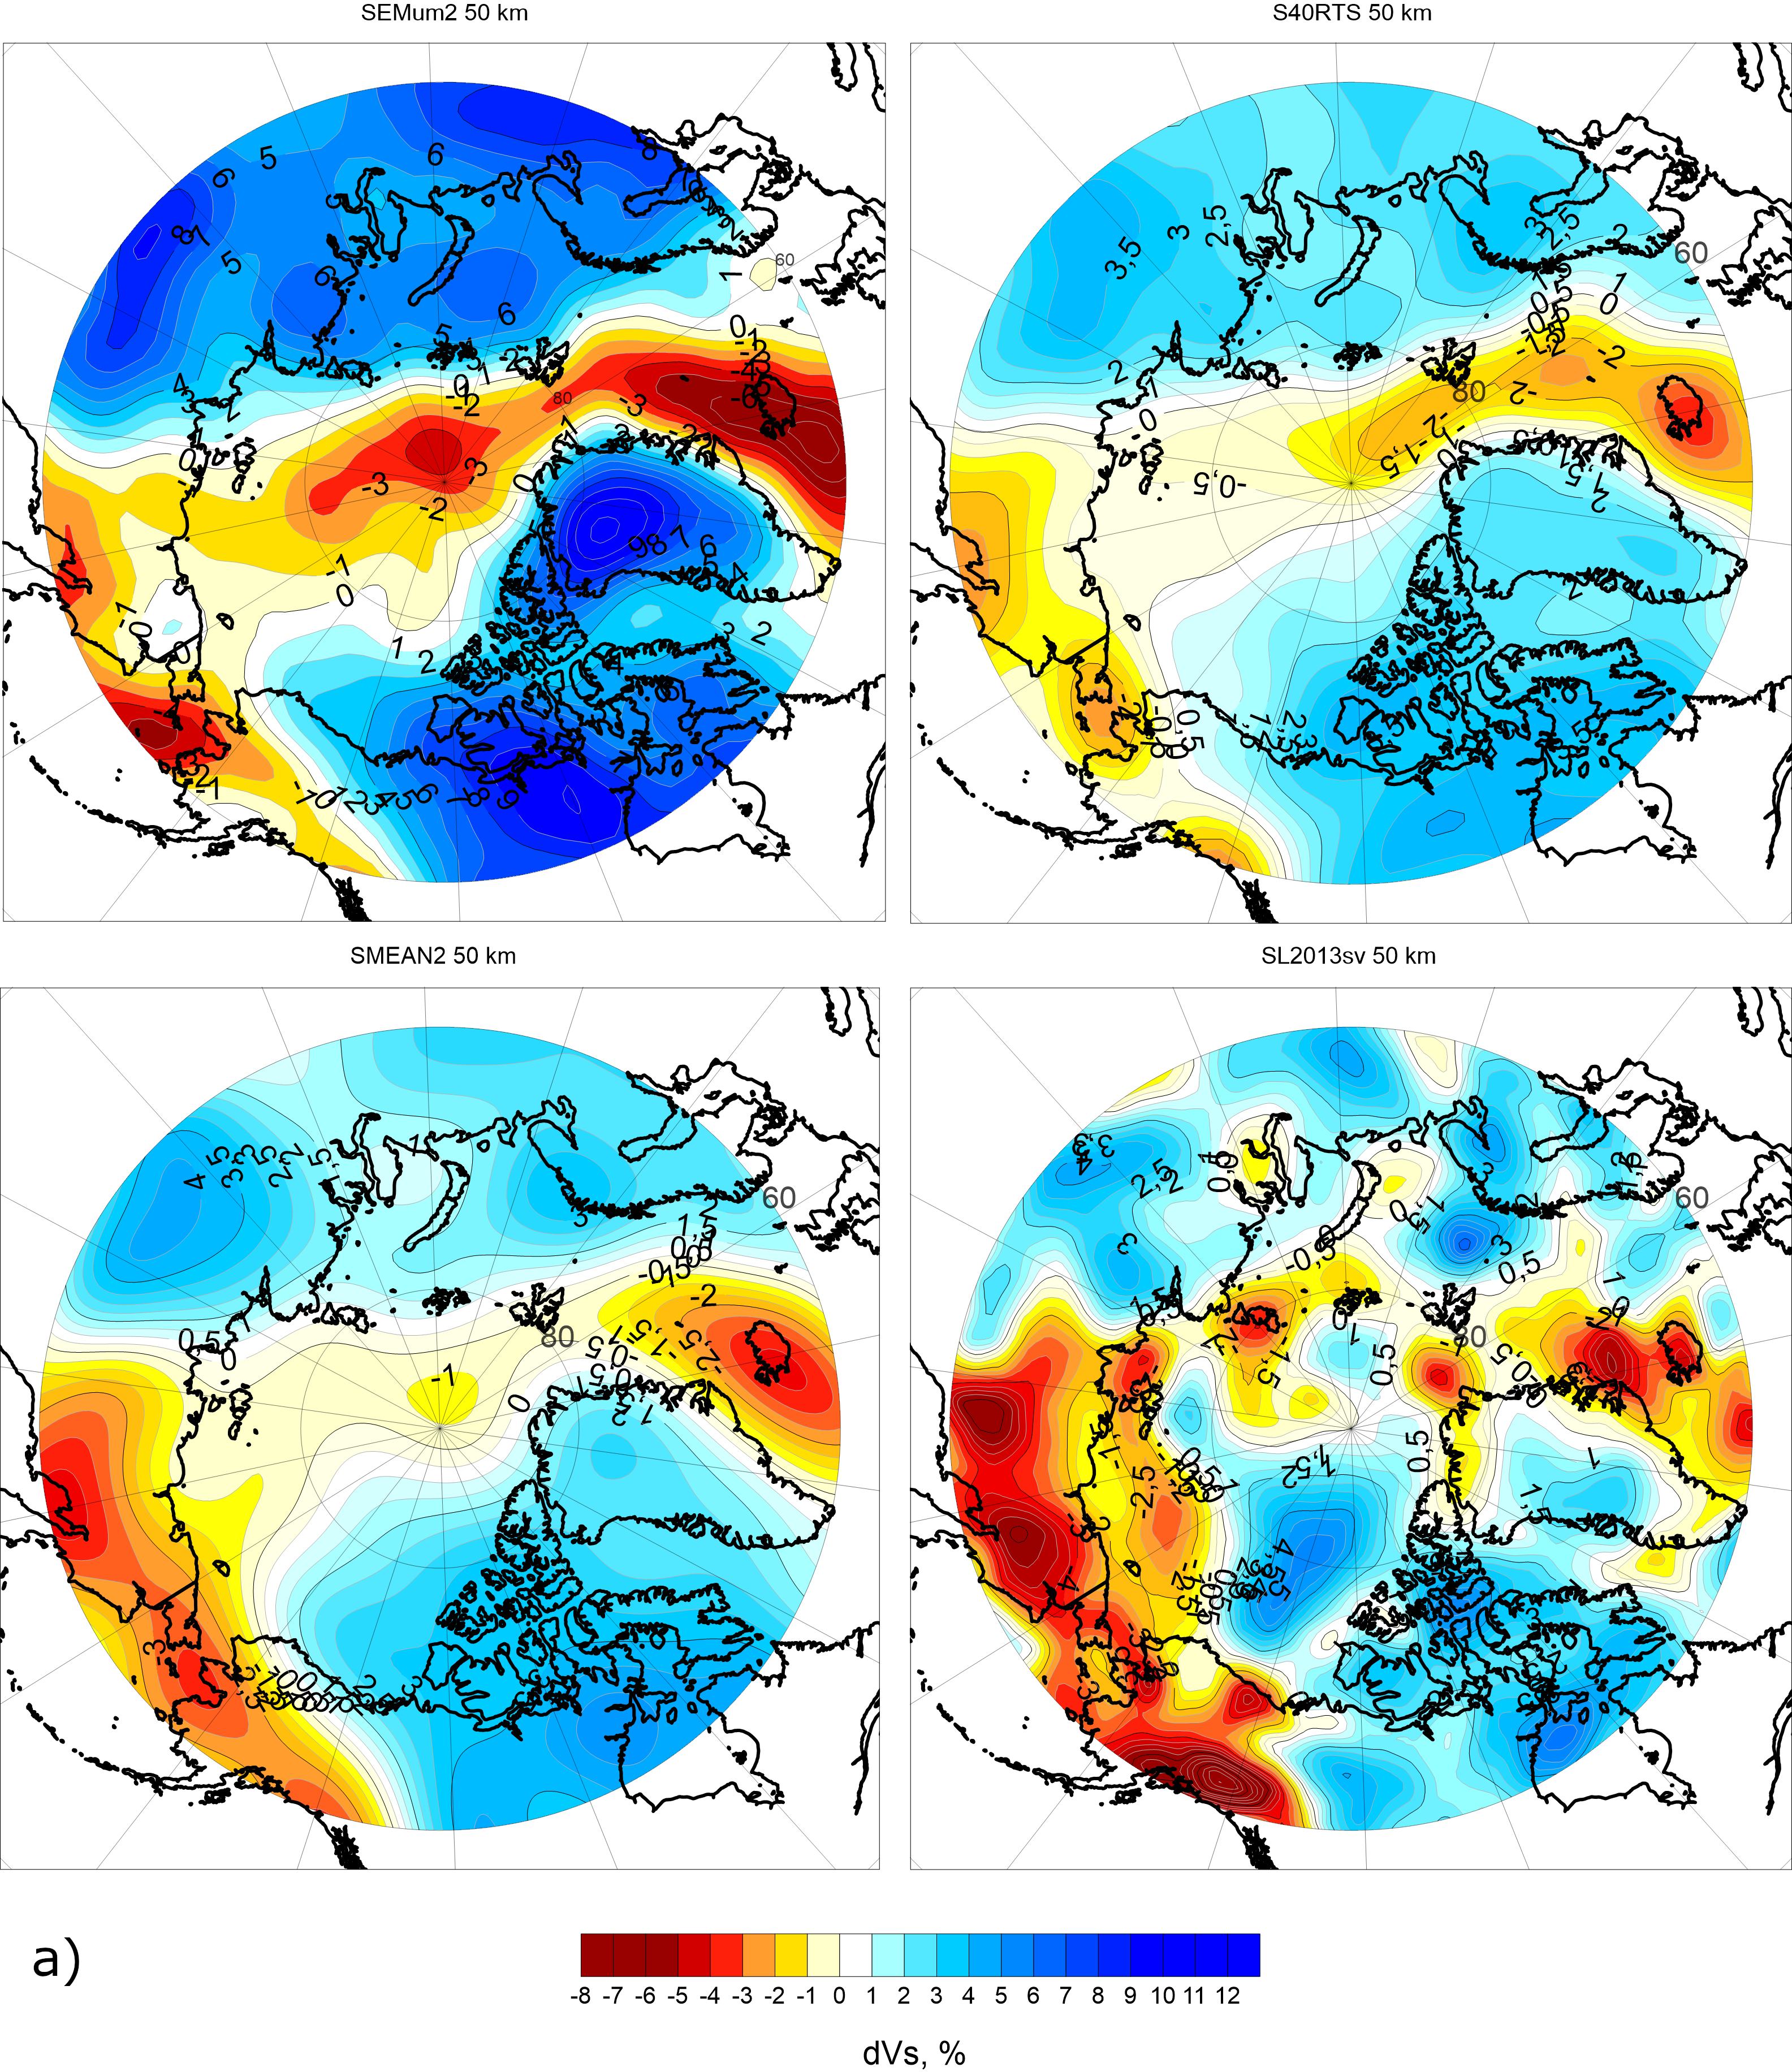
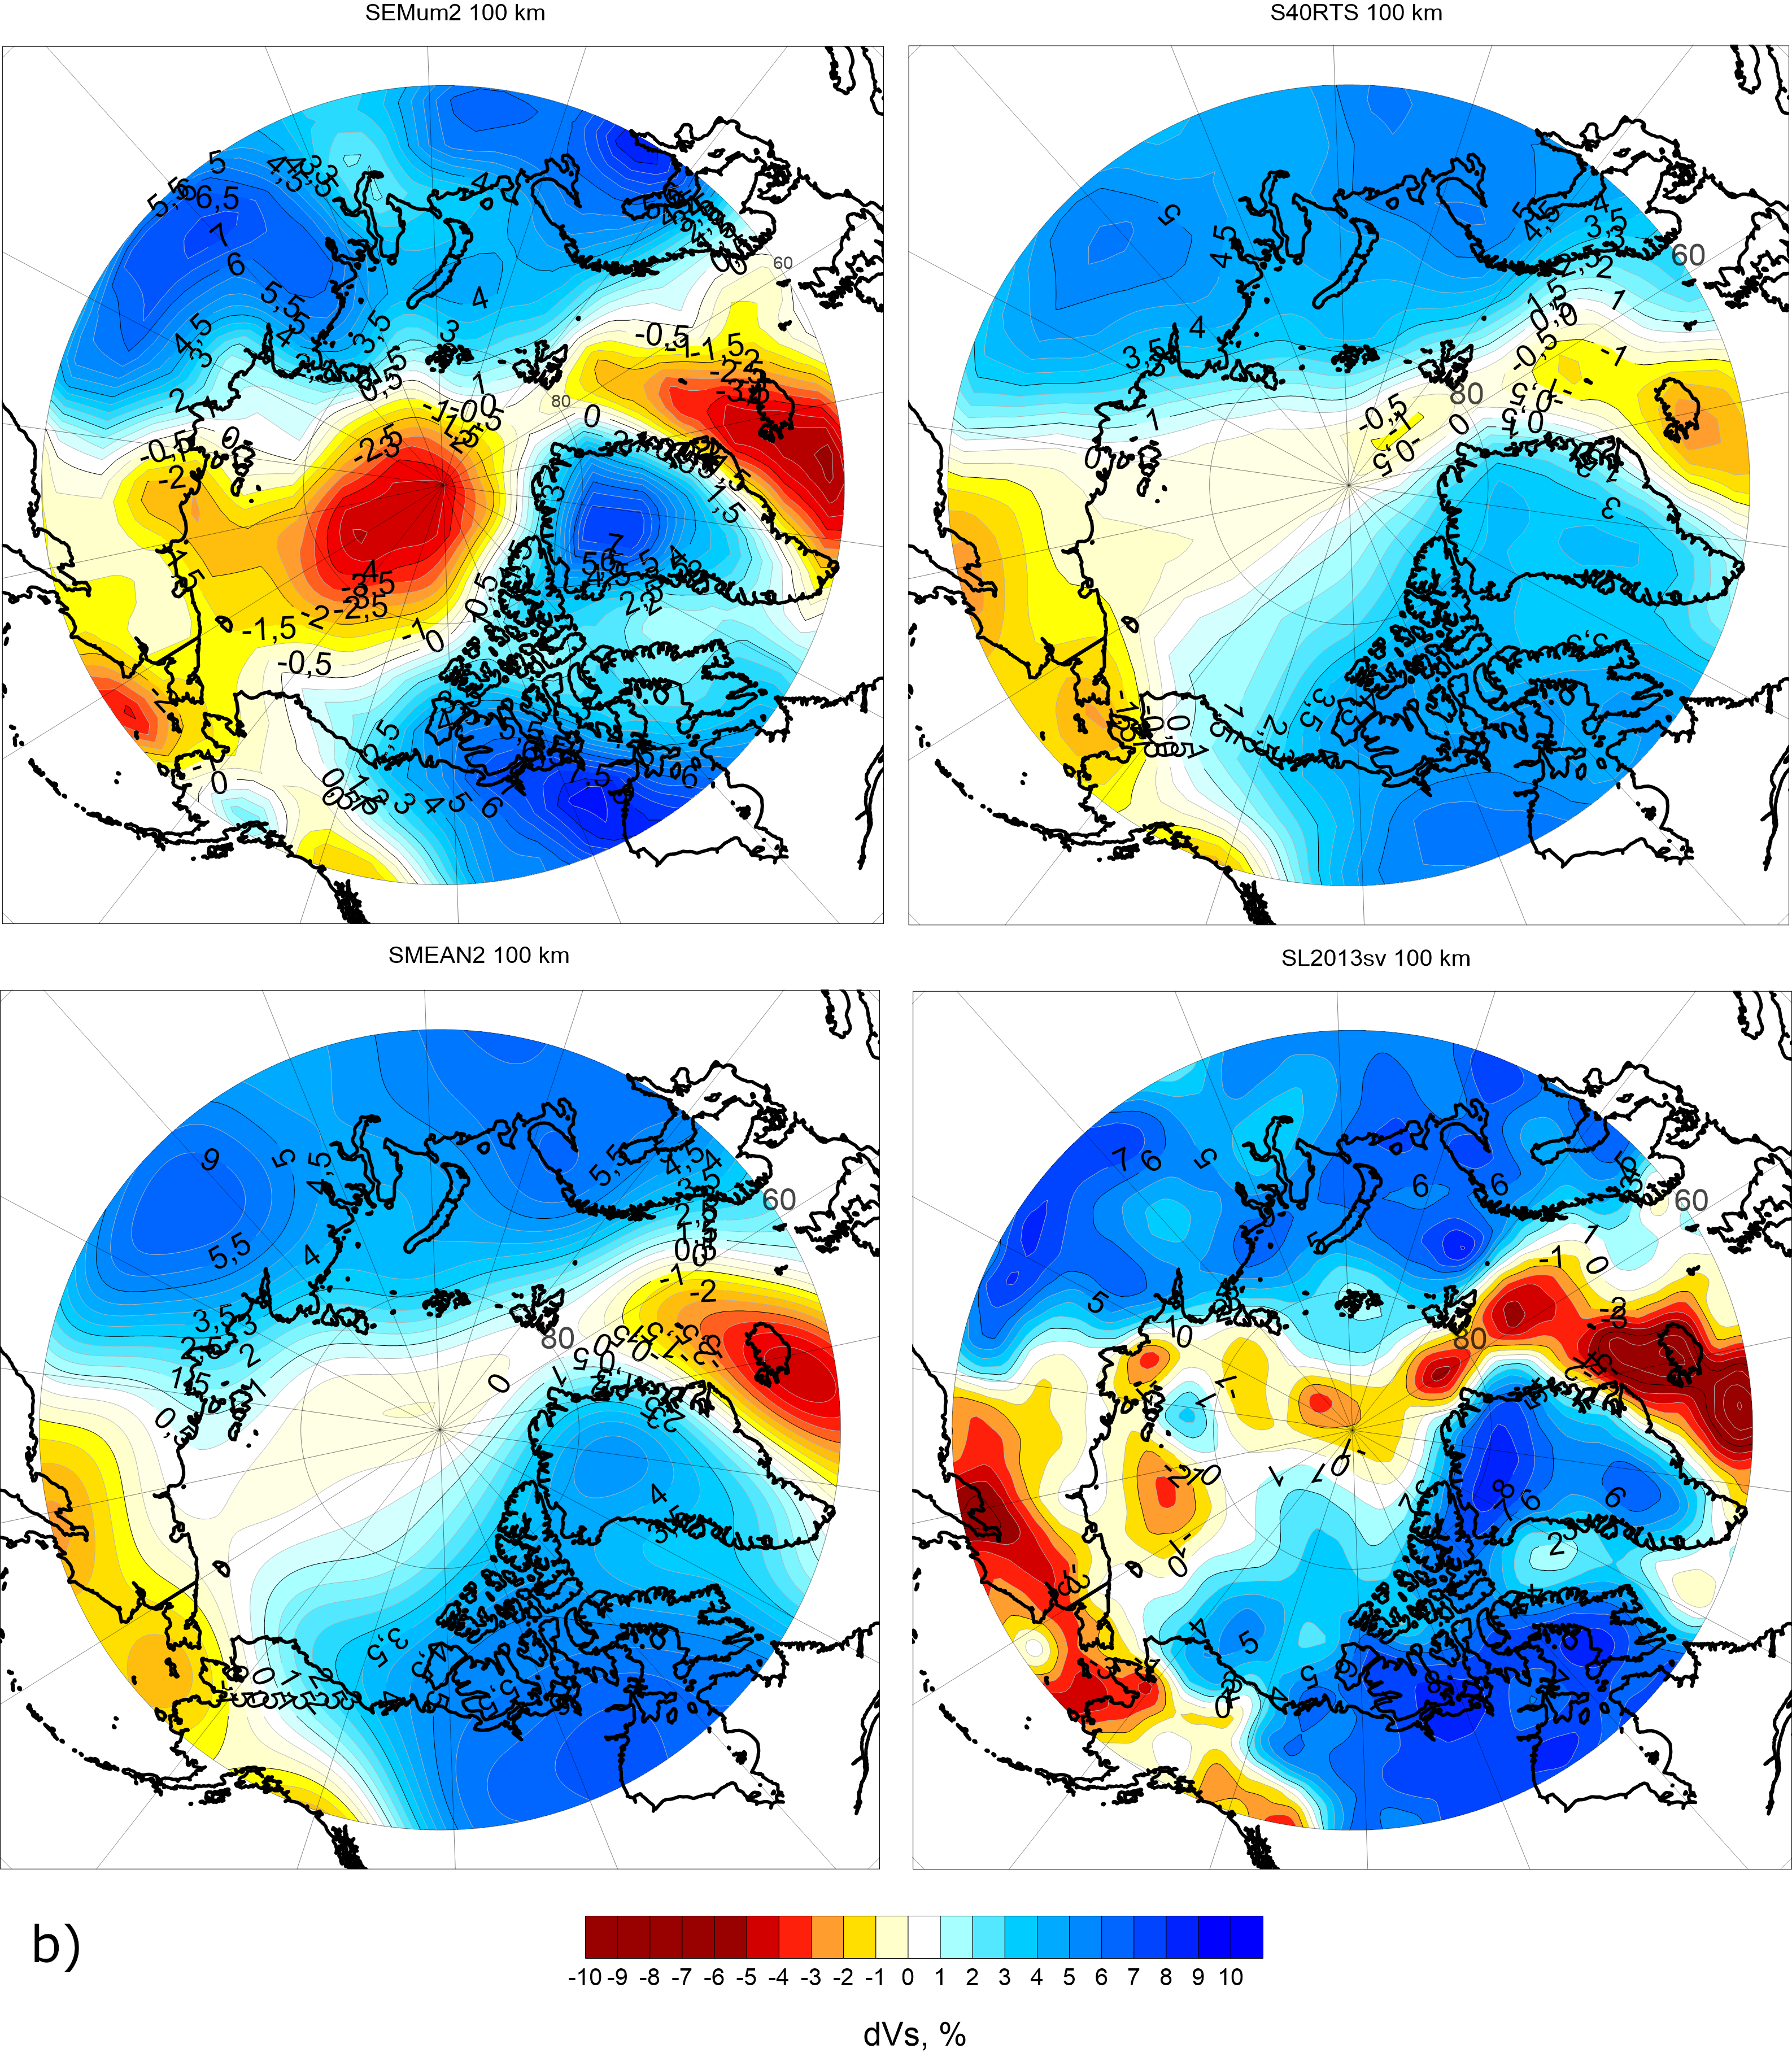
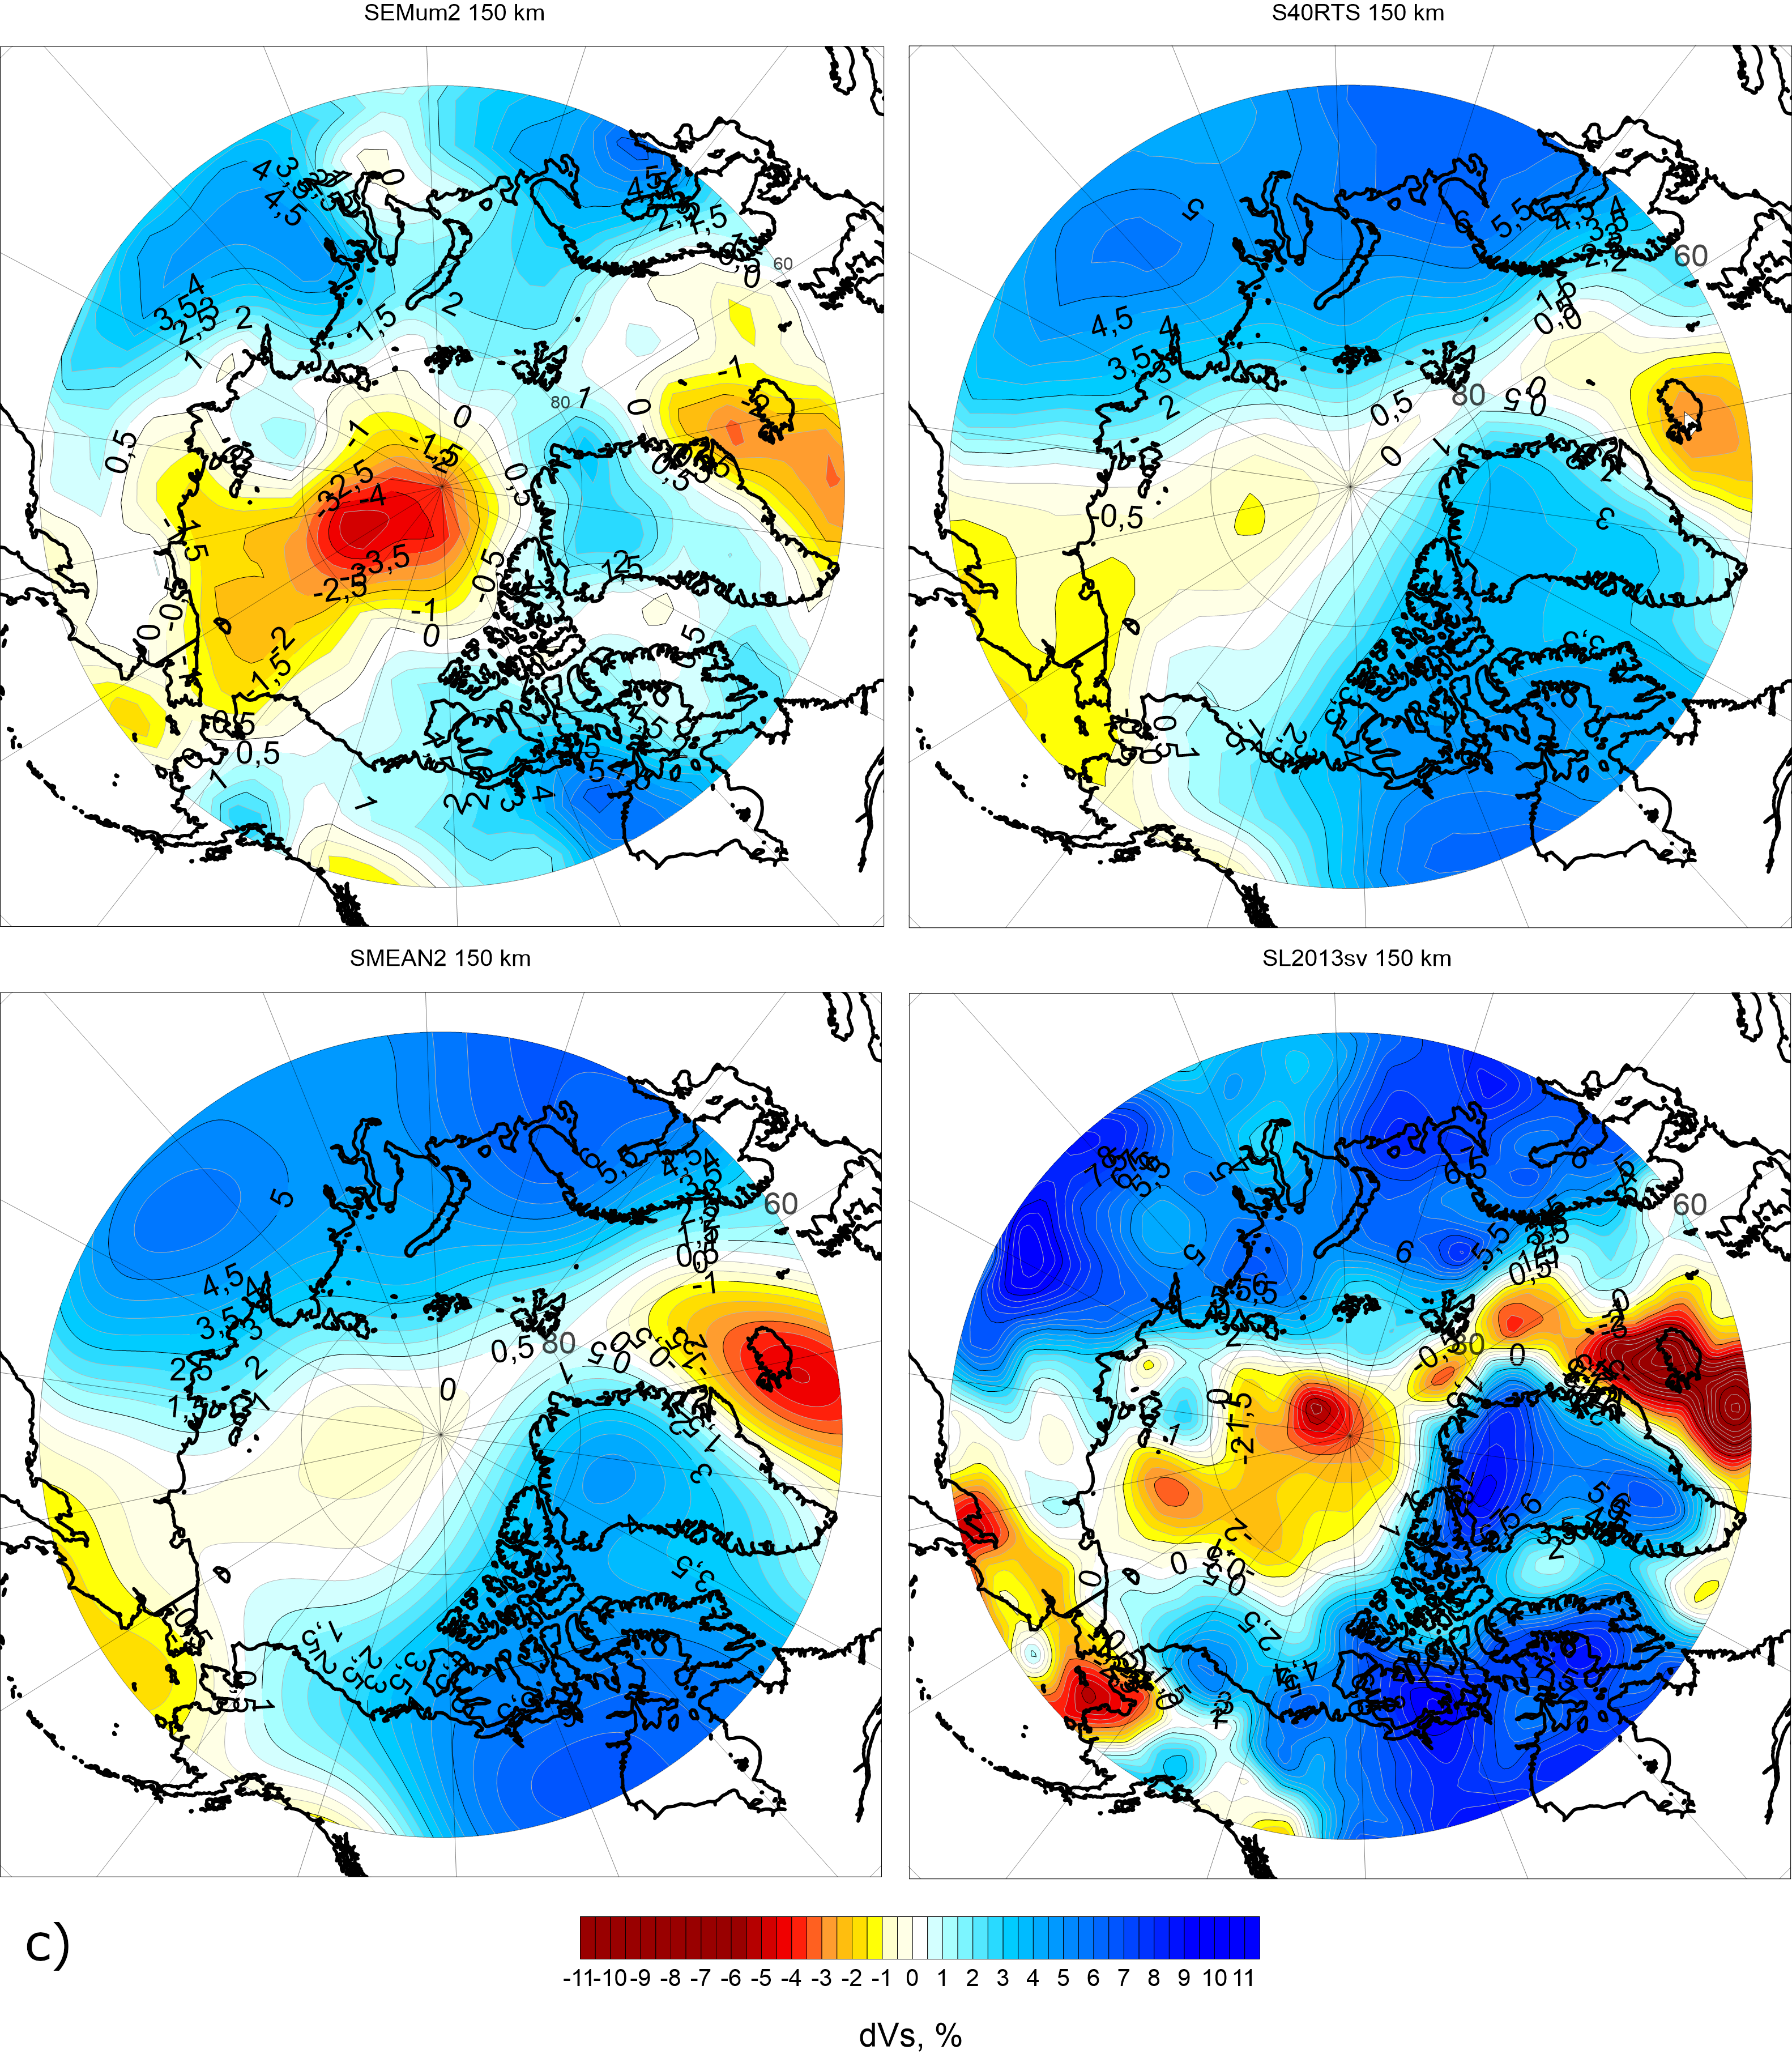
Figure 1.
A comparison of the depth slices for the upper mantle from the SEMum2, S40RTS, SMEAN2 and SL2013sv
models for the depths: 50 km (a), 100 km (b), 150 km (c), 250 km (d), 400 km (e) and 650 km (f).
(Clicking on each picture gives you the opportunity to get a picture in good resolution)
As seen, the SL2013sv model resolution is the best of four models to reveal even small-scale details
in the upper mantle, for example, for Siberia, Greenland and the Arctic Ocean basins at 100–250 km (Fig. 1b, c, d)
Nevertheless, three other models display the main large-scale features of the lithosphere structure similarly.
Similar velocity anomalies can be seen, for instance, for SEMum2 and S40RTS at the continental and
oceanic lithosphere parts, depending on their thickness and age: positive dV values are mainly related
to ancient cratons (e.g. North America or Siberia) and negative dV values are distributed at the Arctic
Ocean and also at North Eastern Asia and Alaska zones.
One of the main differences of the models is in the deep structure of the Siberian and East European cratons:
Eurasian segment of SEMum2 displays two intense velocity anomalies related to them, whereas the corresponding
anomalies in the S40RTS model are about two times lower. Also SEMum2 has relatively high-frequency dV anomalies
for the North American craton, mainly for the Greenland territory.
Other depth slices also demonstrate clearer velocity distribution details for SEMum2
slices than for S40RTS and SMEAN2. The negative dV anomaly (-0.5 … -1%) in the Northern Eurasia at the depth
250 km according to SEMum2 can be related to the corresponding LAB rise from 200 to 60–80 km seen in LITHO1
model [Pasyanos et al., 2014]. At the depths 400–650 km (Fig. 1e, f),
it is difficult to reveal specific velocity distributions for all four model, as the velocity amplitudes decrease.
At these depths, the main difference between the SL2013sv and other three models is a strong negative velocity
anomaly related to the Iceland plume that decays with depth in the SL2013sv and SEMum2 models.
On the contrary, the corresponding anomaly remains at all S40RTS and SMEAN2 slices.
The comparison also shows that at depths 0–400 km approximately, SEMum2 demonstrates better spatial
resolution than the S40RTS and SMEAN2 models and also better agrees with the LAB depth data (LITHO1).
Therefore, this model is considered as the best model, alternative to SL2013sv, for the Russian Arctic zone studies.
The dataset includes text data files for the circumpolar arctic region.
Data taken from open sources and are
freely accessible.
The study area extends from 60° to 90° north latitude, covering the entire Arctic.
Data values are rate anomalies in %.
The SL2013sv, S40RTS, and SEMum2 models have a 0.5° latitude step and 0.5°
longitude step, while the SMEAN2 model has a 1/12° (5’) latitude step and a 0.5° longitude step
Data have the following designations:
S40RTS_Arctic.zip – S40RTS seismic tomography model depth slices (0–650 km with a step 50 km);
SEMum2_Arctic.zip – SEMum2 seismic tomography model depth slices (0–650 km with a step 50 km);
SL2013sv_Arctic.zip – SL2013sv seismic tomography model depth slices (50–650 km with a step 50 km);
SMEAN2_Arctic.zip – SMEAN2 seismic tomography model depth slices (0–650 km with a step 50 km);
tomogr_format.pdf - data format descriptions.
In 2025, the North Eurasia region lithosphere was additionally studied using the REVEAL seismic tomography model
[Thrastarson et al., 2024]. The velocity anomalies in REVEAL P- and S-wave velocity slices (Fig. 2 and Fig. 3,
respectivlely) for 50, 100, 150, 250, 400 and 650 km depth generally match the known information on the lithospheric structure of northern Eurasia
that was formed and shaped by the mutual influence of such processes as ancient East Europeaqn and Siberian craton stabilization,
Paleozoic and Mesozoic orogenesis stages, Mesozoic plume–rift tectonic stage, and Pacific subduction and accretion in Late Mesozoic-Cenozoic.
The REVEAL study area extends from 50.25° to 79.75° North latitude and from 25.25° to 189.75° East longitude,
covering the Northern Eurasia.
Data values are velocity anomalies in percents.
The REVEAL model has a 0.5° latitude step and 0.5° longitude step.
REVEAL data have the following designations:
vpv_relative_10_700km_0p5
— REVEAL seismic tomography model depth slices (10–700 km
with a step 10 km) according to P-waves.
vsv_relative_10_700km_0p5
— REVEAL seismic tomography model depth slices (10–700 km
with a step 10 km) according to S-waves.
Description of the data format.
Figure 2.
A comparison of the depth slices for the lithosphere and the upper mantle according to the REVEAL model (P-waves)
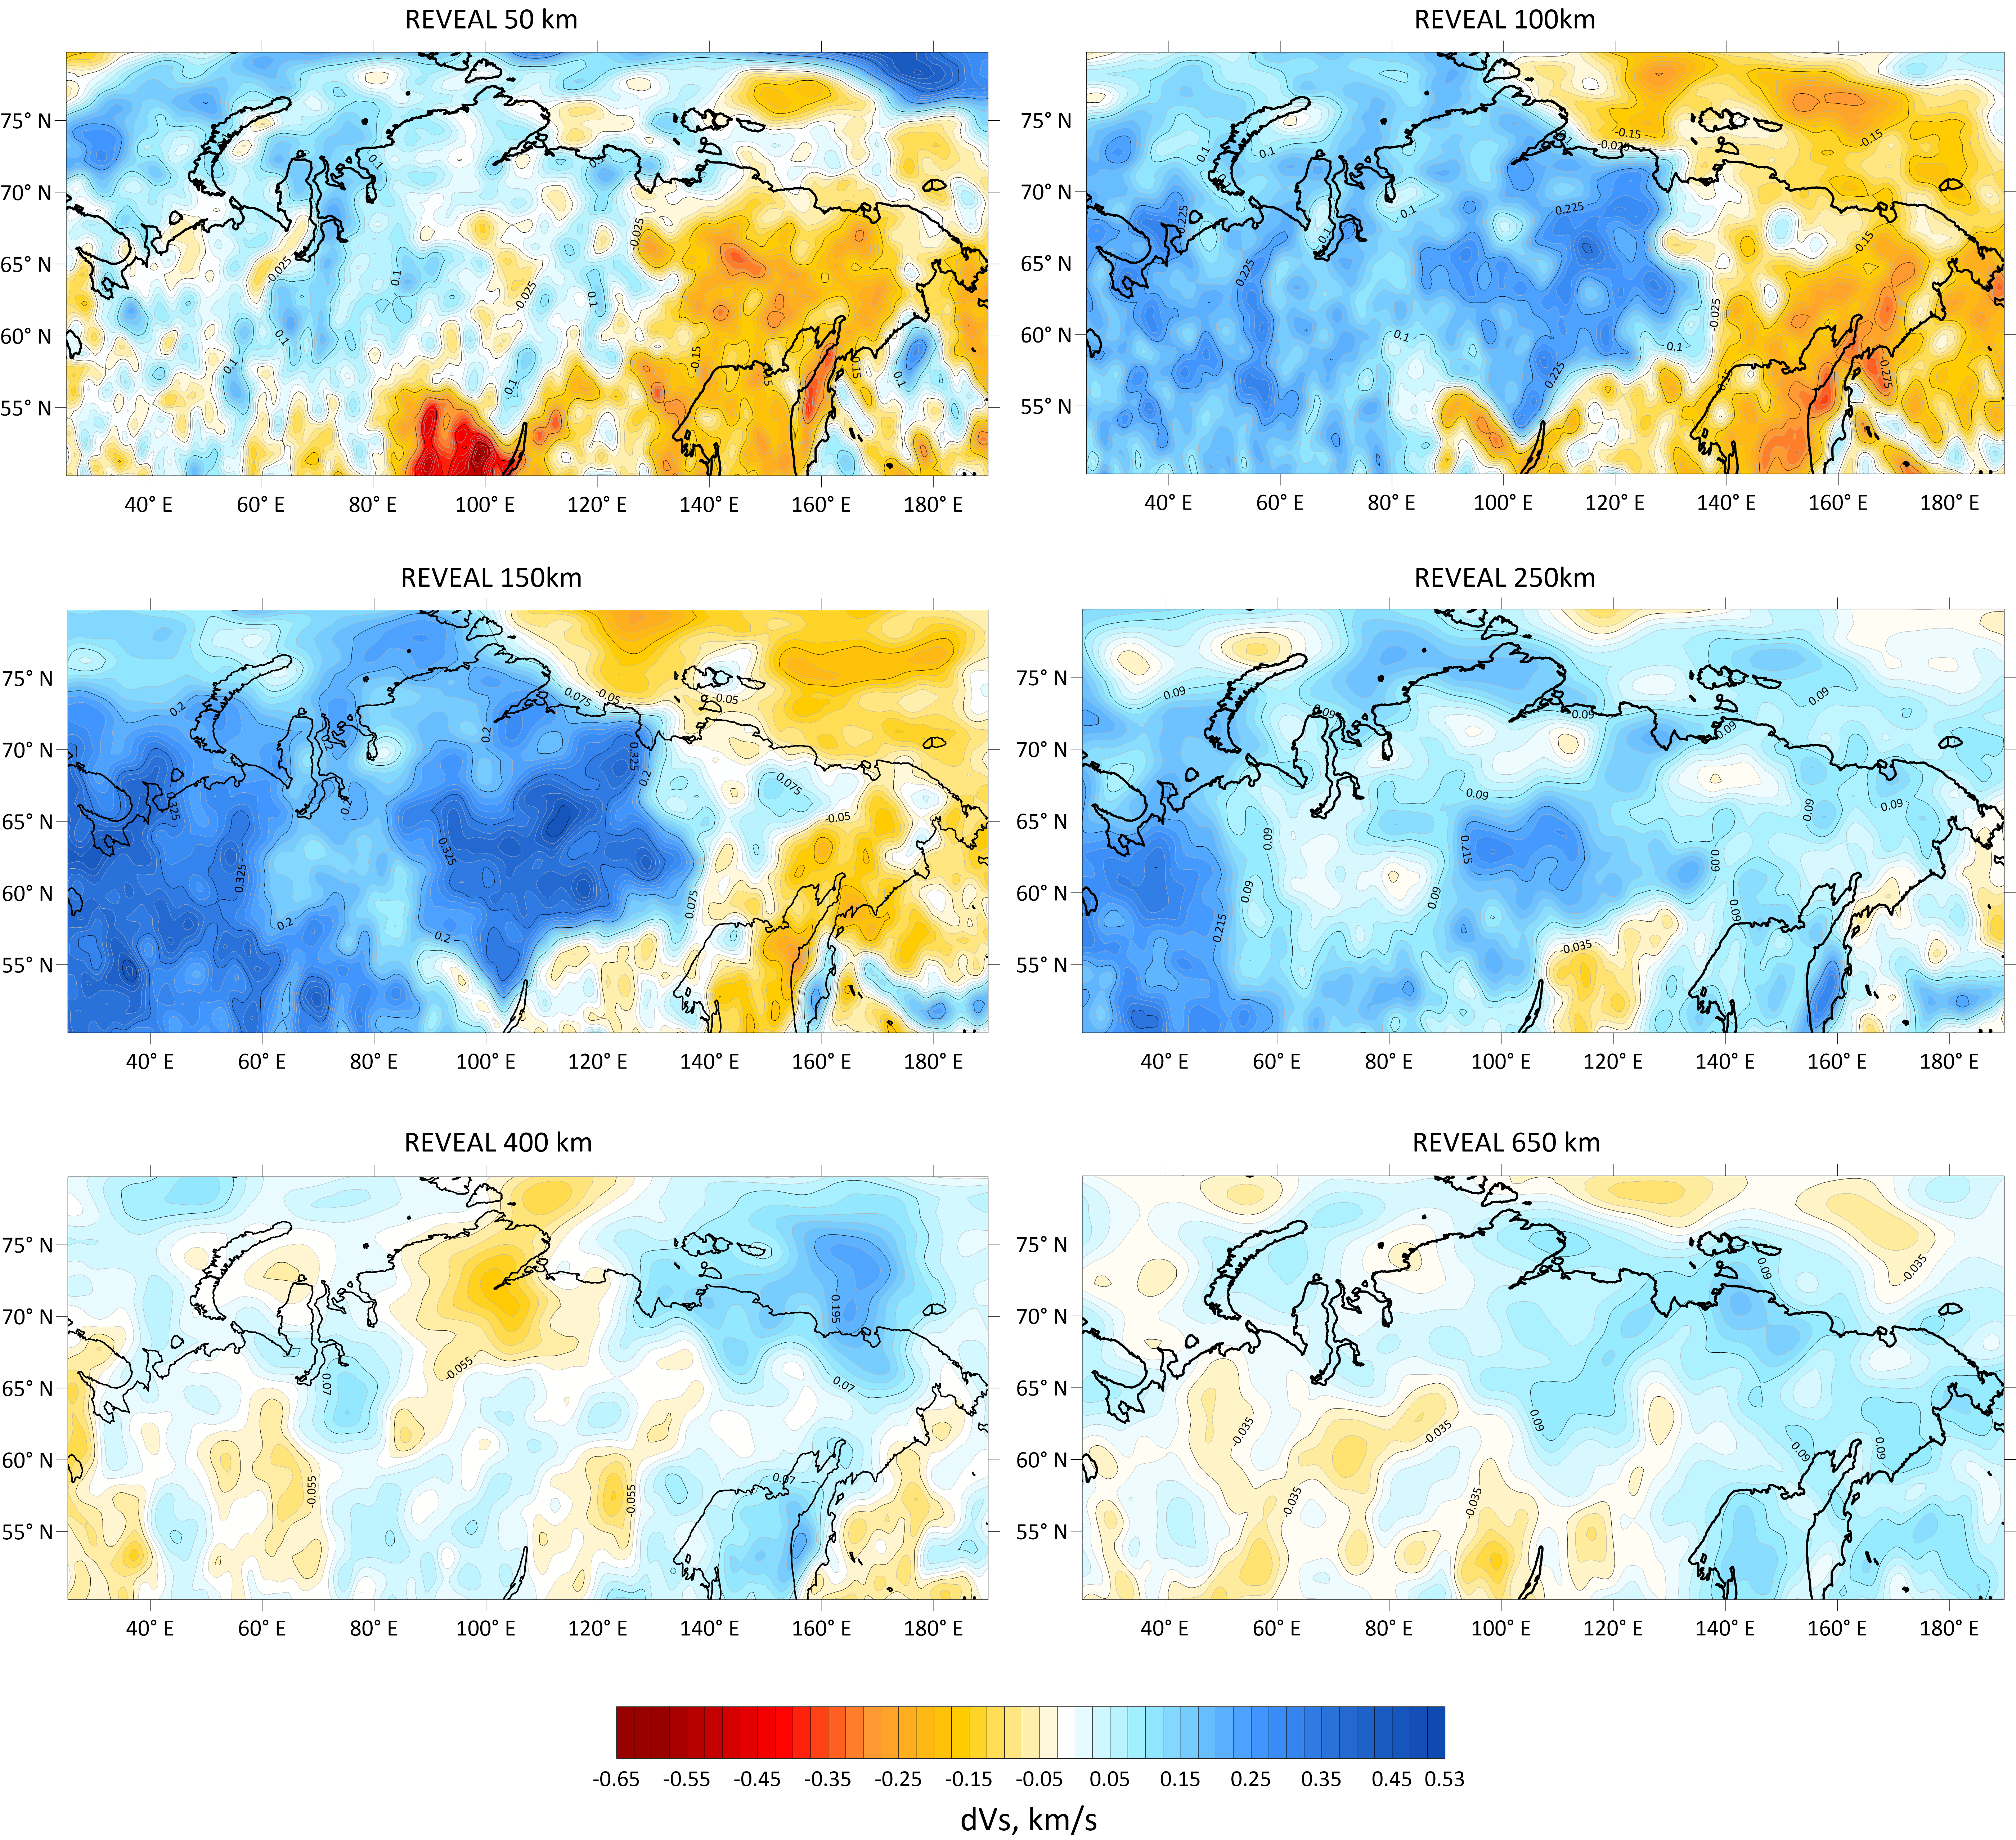
Figure 3.
A comparison of the depth slices for the lithosphere and the upper mantle according to the REVEAL model (S-waves)
References
Auer L., Boschi L., Becker T. W., Nissen-Meyer T. and Giardini D. (2014).
Savani: a variable-resolution whole-mantle model of anisotropic shear-velocity variations based on multiple datasets.
Journal of Geophysical Research, 119(4), 3006-3034.
Hosseini K., Matthews K. J., Sigloch K., Shephard G. E., Domeier M. and Tsekhmistrenko M. (2018).
SubMachine: Web-Based tools for exploring seismic tomography and other models of Earth's deep interior.
Geochemistry, Geophysics, Geosystems, 19. doi:10.1029/2018GC007431
Lekic V., and Romanowicz B. (2011). Inferring upper-mantle structure by full
waveform tomography with the spectral element method.
Geophysical Journal International., 185(2), 799–831.
Pasyanos M. E., Masters T. G., Laske G. and Ma Z. (2014).
LITHO1.0: An updated crust and lithospheric model of the Earth.
Journal of Geophysical Research, 119(3), 2153–2173.
Ritsema J., Deuss A. A., Van Heijst H. J., and Woodhouse J. H. (2011).
S40RTS: a degree-40 shear-velocity model for the mantle from new Rayleigh wave dispersion,
teleseismic traveltime and normal-mode splitting function measurements.
Geophysical Journal International, 184(3), 1223–1236.
Schaeffer A. J., and Lebedev S. (2013).
Global shear speed structure of the upper mantle and transition zone.
Geophysical Journal International, 194(1), 417–449.
Simmons N. A., Forte A. M., Bosch L., Grand S. P. (2010).
GyPSuM: A joint tomographic model of mantle density and seismic wave speeds.
Journal of Geophysical Research, 115(B12), B12310.
Thurber C. (2003). Seismic tomography of the lithosphere with body waves.
Pure and Applied Geophysics, 160(3), 717–737.
Thrastarson S., van Herwaarden D.P., Noe S., Schiller C.J., Fichtner A. (2024)
REVEAL: A global full-waveform inversion model. Bulletin of the Seismological Society of America, 114 (3), 1392-1406.
https://doi.org/10.1785/0120230273
|
|
|
|