|
ULF wave indices from conjugate magnetometer arrays in Antarctica and Greenland
Olga V. Kozyreva1, Vyacheslav A. Pilipenko2
1Institute of Physics of the Earth, Moscow, Russia 2 Geophysical Center, Moscow, Russia
The interaction between the solar wind with embedded interplanetary magnetic field (IMF)
and the Earth’s magnetosphere has often been viewed using the implicit assumption of laminar plasma flow.
However, in magnetospheric plasma dynamics magnetohydrodynamic (MHD) turbulence plays a fundamental role.
Progress in understanding and monitoring turbulent processes in space physics was hampered by the lack
of convenient tools for their characterization. The turbulent character of solar wind drivers and
the existence of magnetospheric MHD waveguides and resonators in the ultra low frequency (ULF)
range (~2-10 mHz) ensures a quasi-periodic response to an external forcing.
Therefore, much of the turbulent nature of solar wind-magnetosphere-ionosphere interaction can be
monitored with observations in the ULF band. Kozyreva et al. [2007] constructed
a new geomagnetic index, coined a “ULF wave index,” characterizing the medium-scale variability
of near-Earth electromagnetic processes. Using this index, many new features of the magnetosphere
dynamics has been revealed [Pilipenko et al., 2017].
However, the existing index that supposedly should characterize the magnetospheric ULF wave
activity was derived from stations in the Northern hemisphere only. If ULF wave power in conjugate
hemispheres were strongly asymmetric an index derived from one hemisphere data only may be misleading.
Therefore, it is important to examine how strong is the interhemispheric asymmetry of ULF wave power.
To answer this question, we have constructed the database of ULF indices for Northern and Southern
hemispheres from conjugate arrays in Greenland and Antarctica.
Construction of a regional ULF wave index
We select conjugate sites from the Antarctica-Greenland magnetometer arrays.
The Virginia Tech deployed autonomous adaptive low-power instrument platforms (AAL-PIP) at sites
in Antarctica that are magnetically conjugate to the Greenland West Coast magnetometer chain along the 40°
magnetic meridian (LT~UT-2.3). All stations are equipped with three-axis fluxgate magnetometers with
1-sec cadence. A map in Figure 1 shows the locations of the Antarctic stations (in red color)
and the geomagnetic conjugate points of their counterparts in Greenland (in blue color).
The geocentric and geomagnetic coordinates of Antarctica stations, and geocentric coordinates
of geomagnetic projection of Greenland stations (marked by *) onto the Southern hemisphere are
given in Table 1.
|
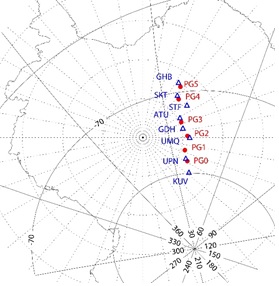
Figure 1. Map of the ground magnetic stations used for calculation of the regional ULF wave
index in Greenland (blue) and Antarctica (red)
|
| (S) |
CGM
Lat |
CGM
Lon |
Geo
Lat |
Geo
Lon |
(N*) |
| |
|
|
-84,01 |
86,36 |
UPN |
| PGO |
-78,7 |
38,2 |
-83,67 |
88,68 |
|
| |
|
|
-84,14 |
59,64 |
UMQ |
| PG2 |
-75,7 |
39,1 |
-84,42 |
57,95 |
|
| |
|
|
-84,69 |
30,89 |
ATU |
| PG3 |
-73,9 |
36,7 |
-84,81 |
37,63 |
|
| |
|
|
-83,05 |
08,31 |
SKT |
| PG4 |
-71,2 |
36,4 |
-83,34 |
12,25 |
|
| |
|
|
-81,60 |
02,07 |
GHB |
| PG5 |
-69,9 |
37,2 |
-81,96 |
05,71 |
|
Table 1. Pairs of magnetometer stations in Northern/Southern hemispheres. Coordinates were
calculated for epoch 2017 using the VITMO model https://omniweb.gsfc.nasa.gov/vitmo/cgm.html
|
The corrected geomagnetic coordinates (CGM) of conjugate Greenland and Antarctica stations
in fact have mismatch between CGM latitudes |ΔΦ| = 0,5-1,2°. This fact indicates the CGM coordinates
are not a good measure of the site conjugacy at high latitudes, and more reliable way to estimate interhemispheric
conjugacy is to use the field line modeling. According to field line projection of Northern stations onto the
Southern hemisphere we have formed the following pairs of conjugate sites: PG0-UPN, PG2-UMQ, PG3-ATU, PG4-SKT, and PG5-GHB (Figure 1).
The data for the winter months in Antarctica, are not available owing to “freezing” of equipment because of lack of power supply.
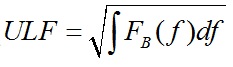
The index was calculated in the following way. The data have been detrended with a cut-off frequency 0,5 mHz.
For any UT hour, discrete Fourier spectra of two horizontal components are calculated with the use of Filon’s
quadrature method in an 1 hour time window. The background spectrum FB(ƒ) may be well approximated
in a log-log plot as a straight line (“colored-noise” spectrum ∝ ƒ-α).
The linear fit is applied in the frequency band from ƒL = 1 mHz
to ƒH = 8 mHz.
Then, a discrimination line, separating the background noise and signal spectra, has been constructed.
The bump above the discrimination line is considered as the contribution from a band-limited signal.
Band-integrated noise spectral power Nj is calculated at each j-th station as the area beneath
the background power spectrum FB, and the signal spectral power Sj is the area
of the bump above the discrimination level, namely
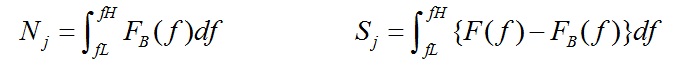
The regional ULF wave index is calculated from the band-integrated total power Tj = Sj + Nj
at each station of a latitudinal profile by the selection of a station only with maximal amplitude.
The index is normalized in such a way to have dimension in nT,
Example of the usage of interhemispheric ULF wave indices
We have selected first for the analysis the observations made during winter months, when the contrast
between ionospheric conductances must be very high, about order of magnitude. For a visual inspection of interhemispheric
properties of ULF power, we have plotted for daytime time hours the X-component magnetograms (Figure 2). The plot also shows the
hourly value of the regional ULF index, that is maximal power of Pi3/Рс5 fluctuations in Antarctica and Greenland, correspondingly.
Also, the plot shows the latitude Φ where the ULF power maximum occurs. For a general characterization of substorm activity
the bottom panel shows SML index. During the event on 2018/02/01 several Pc5 wave packets are observed around local noon
on a quiet geomagnetic background (|SML|<50 nT) (Figure 2). The ULF index for Northern hemisphere turns out to be
about the same as that for Southern hemisphere, they are ~30 nT and differ not more than ~10%. Therefore, one may conclude
that despite a considerable difference in the conductances of the Sun illuminated and non-illuminated ionospheres,
the ULF powers in both hemispheres are nearly the same.
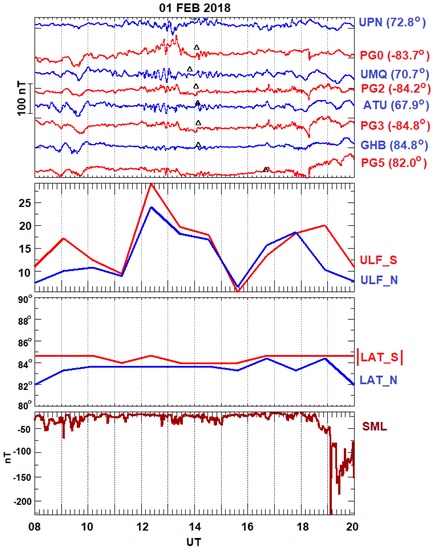
Figure 2. The dayside ULF wave activity on 2018/02/01: upper panel – magnetograms of conjugate pairs of stations
in the Northern (blue) and Southern (red) hemispheres; 2-nd panel – regional ULF index for (N) and (S) hemispheres;
3-rd panel - latitudes of the Pc5 maximum in both hemispheres; and 4-th panel – SML index. White triangles near
magnetograms denote local noon, numbers near station codes denote CGM latitudes
Description of the ULF index database
The database is calculated for the period 2002-2019 and is constantly updated.
Data for the winter months in Antarctica may not be available due to the "hanging" of equipment
in the absence of power supply.
The conjugated ULF indices for the northern and
southern hemispheres and
magnetograms
for quick viewing are in the public domain.
A daily ASCII file with indexes contains 24 rows and 5 columns:
1 is the station where the index maximum is, 2 is the value of S, 3 is the value of N, 4 is the value of T (S+N),
5 is the ratio (S/N).
The calculated database of regional ULF wave power index for the Antarctic-Greenland sector may be used as a convenient
parameter for the statistical analysis. Feedback from possible users will facilitate our efforts to improve this index.
Magnetometer data availability. The Antarctic magnetometer data are available from the web-page
for the Virginia Tech AAL-PIP project http://mist.nianet.org. Magnetometer data from
Greenland array can be obtained from the Tromso Geophysical Observatory http://flux.phys.uit.no/geomag.html.
Geomagnetic indices are downloaded from the SuperMAG portal https://supermag.jhuapl.edu/.
References
Kozyreva O., V. Pilipenko, M.J. Engebretson, K. Yumoto, J. Watermann, N. Romanova (2007).
In search of a new ULF wave index: Comparison of Pc5 power with dynamics of geostationary relativistic electrons.
Planetary Space Science, 55, 755–769.
Kozyreva O.V., V.A. Pilipenko, M.D. Hartinger, T.R. Edwards (2023).
Comparison of ULF wave indices from conjugate magnetometer arrays in Antarctica and Greenland, A. Kosterov et al. (eds.).
Problems of Geocosmos—2022, Springer Proceedings in Earth and Environmental Sciences (in press).
Pilipenko V.A., O.V. Kozyreva, M.J. Engebretson, A.A. Soloviev (2017).
ULF wave power index for the space weather and geophysical applications: A review.
Russ. J. Earth Science, 17, N2, ES1004, doi:10.2205/2017ES000597.
|
|
|