Explanatory Note
The research was carried out within the framework of the
Soviet-Japanese cooperation in the course of the Geotraverse Project
( Rodnikov et al., 1982, 1985 ).
This was the first
geotraverse to be carried out prior to the preparation of the Global
Geoscience Transects Project elaborated by the Inter-Union
Commission on the Lithosphere. At that time, the Geotraverse became
the historical bridge that linked the scientific researches of two
countries, Russia and Japan, in studying the deep structure of the
lithosphere in the transition zone from the Asian continent to the
Pacific Ocean, which is characterized by higher seismicity and
volcanic activity.
Leaders of the Project were Dr. A. Rodnikov (Geophysical Center
RAS, Russia) and Prof. S. Asano (Tokyo University, Japan).
The results of geological-geophysical research carried out during the
Soviet-Japanese cooperative study of the structure and dynamics of the
Earth's crust and upper mantle along the geotraverse have been published in
Marine Geophysical Researches, v.7, 379-387,
1985 (Rodnikov et al., 1985).
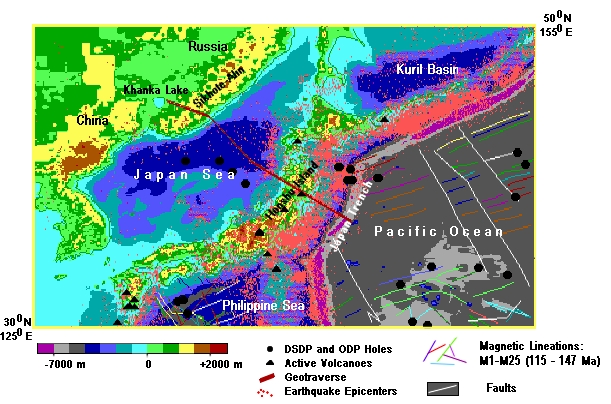
The profile stretches from the Khanka Lake in Primorje, across the
Sikhote-Alin, the Japan Basin of the Sea of Japan, the Honshu Island
(crosses the Oga Peninsula, the region of "green tuffs", the
Kitakami massif), the Japan Trench, and reaches the Pacific Ocean.
Location of the Japan Sea Geotraverse
 The main features of the deep structure of the Japan Geotraverse
area can be seen also from the field of the geoid heights. To make the
regional features (smaller spatial size) of the deep density structure
of the region more easy visible we construct the field of the gradients
of the geoid heights. Lower degrees up to 15 power spherical harmonics
are removed to make the regional structure more easy visible.
The main features of the deep structure of the Japan Geotraverse
area can be seen also from the field of the geoid heights. To make the
regional features (smaller spatial size) of the deep density structure
of the region more easy visible we construct the field of the gradients
of the geoid heights. Lower degrees up to 15 power spherical harmonics
are removed to make the regional structure more easy visible.
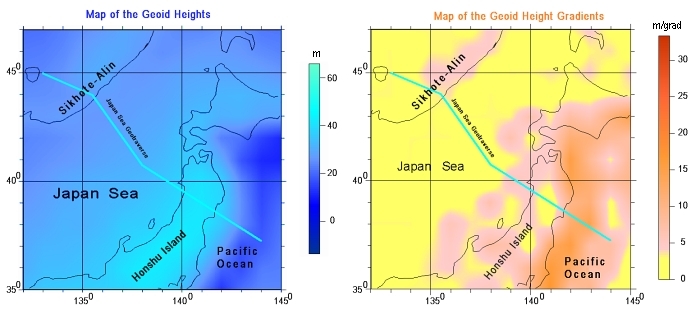 The map of the geoid heights was obtained from the
EGM-96
International Geoid Model (that has up to 360 degree expansion in spherical
harmonics). As it can be seen from the figure, the geoid heights
(given in metres) change very considerably throughout the region under
study. The main regional feature which can be seen at the figure is the
decrease in the geoid heights above the Japan Islands. This decrease is
abrupt from the deep trench side and rather smooth from the back side.
It is known that the geoid height depends not only from the mean
density value at the point but also from the first moment of the density
distribution with depth. It means that isostatically compensated blocks
that have different density variations with depth also cause a difference
in the geoid heights
( Turcotte and Schubert, 1982 ).
Thus the boundaries between ancient blocks (and thus
isostatically compensated) of different inner structure can be detected
if to construct the field of gradients of the geoid heights. In the used
procedure, first 15 long-waves harmonics were removed to enlarge the
effect of detecting of smaller size structures.
At the map obtained this way a number of the regional structures
can be seen clearly. The main features of the gradients map are the recent
Japan subduction zone. Besides, a few weaker anomalies can be seen.
There are anomalies crossing the Honshu Island, and two others located
along the western coast of Honshu and along Sikhote-Alin mountain belt.
The anomaly connected with the western coast of Honshu appears to be
connected with the young subduction zone suggested to arise here in
( Uyeda, 1991 ).
The anomaly that coincides with Sikhote-Alin mountain ridge can be
connected with the suggested here an ancient subduction zone
( Romanovsky, 1981 ).
The Geotraverse shows the deep structure of the lithosphere and
asthenosphere to the depth of 250 km. Geological, seismic, gravimetric,
magnetotelluric and geothermal data demonstrate a thick asthenosphere
in the upper mantle beneath the Japan Sea.
The map of the geoid heights was obtained from the
EGM-96
International Geoid Model (that has up to 360 degree expansion in spherical
harmonics). As it can be seen from the figure, the geoid heights
(given in metres) change very considerably throughout the region under
study. The main regional feature which can be seen at the figure is the
decrease in the geoid heights above the Japan Islands. This decrease is
abrupt from the deep trench side and rather smooth from the back side.
It is known that the geoid height depends not only from the mean
density value at the point but also from the first moment of the density
distribution with depth. It means that isostatically compensated blocks
that have different density variations with depth also cause a difference
in the geoid heights
( Turcotte and Schubert, 1982 ).
Thus the boundaries between ancient blocks (and thus
isostatically compensated) of different inner structure can be detected
if to construct the field of gradients of the geoid heights. In the used
procedure, first 15 long-waves harmonics were removed to enlarge the
effect of detecting of smaller size structures.
At the map obtained this way a number of the regional structures
can be seen clearly. The main features of the gradients map are the recent
Japan subduction zone. Besides, a few weaker anomalies can be seen.
There are anomalies crossing the Honshu Island, and two others located
along the western coast of Honshu and along Sikhote-Alin mountain belt.
The anomaly connected with the western coast of Honshu appears to be
connected with the young subduction zone suggested to arise here in
( Uyeda, 1991 ).
The anomaly that coincides with Sikhote-Alin mountain ridge can be
connected with the suggested here an ancient subduction zone
( Romanovsky, 1981 ).
The Geotraverse shows the deep structure of the lithosphere and
asthenosphere to the depth of 250 km. Geological, seismic, gravimetric,
magnetotelluric and geothermal data demonstrate a thick asthenosphere
in the upper mantle beneath the Japan Sea.
The Japan Sea Geotraverse
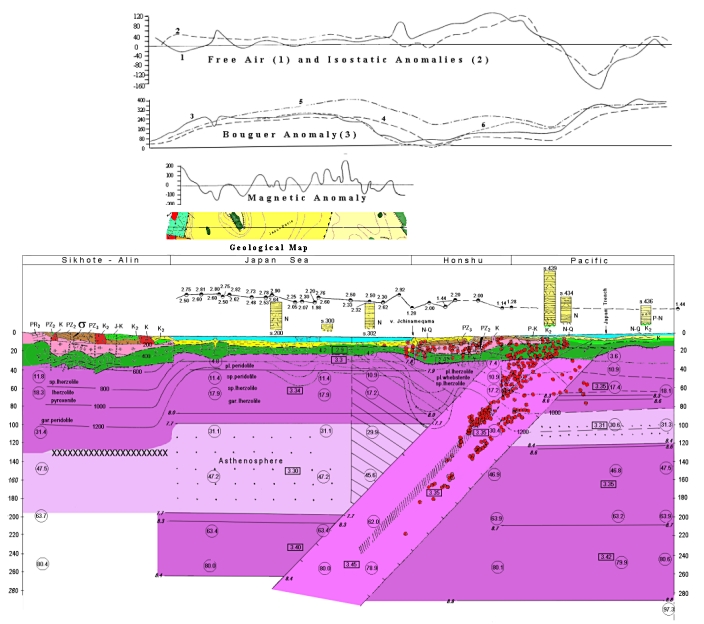
More detailed view of the Geotraverse
Legend
The 1200 o C isotherm is the upper boundary of the partial
melting at the depth of 100 km in the Pacific Ocean. Under the Japan Sea
this isotherm rises to the depth of 40 km have resulted the magmatic
activity for the last 25 Ma. In the Northwest Pacific Basin the eruption
of tholeiitic basalts largely took place over 100 Ma ago, during the
Jurassic - Cretaceous age.
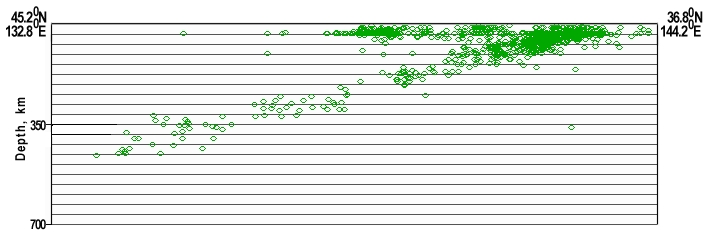
Depth Distribution of 1162
Earthquake Hypocenters along the Japan Sea Geotraverse in
2o Zone According to the World Earthquake Catalog
PDE for the Period 1904-1999
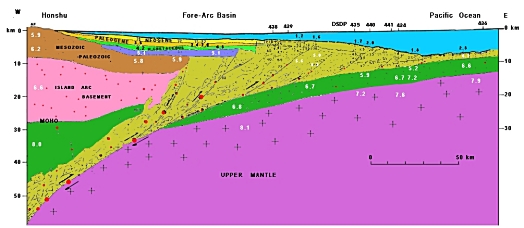
Structural profile through Deep Sea Drilling Project (DSDP) sites
across Japan Trench and forearc region of Miyako, Northeast Japan,
showing acoustics basement, thrust faults, accretionary prism and idealized
distribution of earthquake foci. Based on numerous sources.
Revised from Shiki and Misawa. Values of the seismic
velocities may not be accurate at deep horizon in each vertical
sequences. Seismic velocities are based mainly on refraction information
by Murauchi (1979) and on multi-channel reflection data in Nasu et
al. (1979).
 Since the accomplishment of this geotraverse,
the deep structure of the region, on the whole, remained unchanged,
but new results were obtained by further studies that have
essentially improved the understanding of geodynamic processes
active in the Earth's interior.
The most important are the data
obtained by drilling on the Ocean Drilling Program (ODP)
( Tamaki et al., 1990, 1992;
Active ..., 1995;
Joliet et al., 1995 ),
by tomographic research
( Hasegawa et al., 1991 )
and by palinspastic constructions
( Maruyama et al., 1997
).
Deep sea drilling carried out from the drillship JOIDES
Resolution by the Ocean Drilling Program revealed the basement of the Sea
of Japan
( Tamaki et al., 1990;
Pisciotto et al., 1992 ).
Since the accomplishment of this geotraverse,
the deep structure of the region, on the whole, remained unchanged,
but new results were obtained by further studies that have
essentially improved the understanding of geodynamic processes
active in the Earth's interior.
The most important are the data
obtained by drilling on the Ocean Drilling Program (ODP)
( Tamaki et al., 1990, 1992;
Active ..., 1995;
Joliet et al., 1995 ),
by tomographic research
( Hasegawa et al., 1991 )
and by palinspastic constructions
( Maruyama et al., 1997
).
Deep sea drilling carried out from the drillship JOIDES
Resolution by the Ocean Drilling Program revealed the basement of the Sea
of Japan
( Tamaki et al., 1990;
Pisciotto et al., 1992 ).
Stratigraphy at Leg 127 Drill Sites
(from Tamaki et al., 1990 )
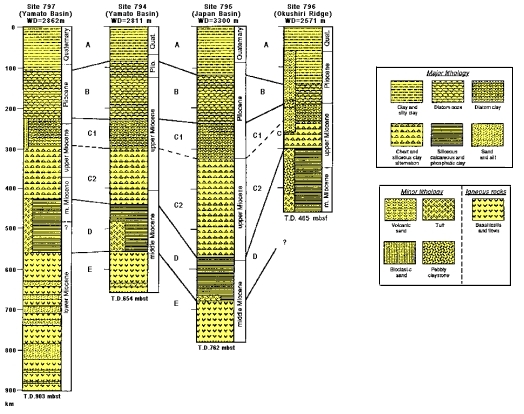
Legs 127 and 128 completed drilling of six sites in the Japan
Sea. Sites 795 and 796 are in the Japan Basin , sites 794 and 797 in
the Yamato Basin, site 799 on the Yamato Rise, and site 798 on the
Oki Ridge.
"Basement rocks of the Sea of Japan backarc basin were encountered
at sites 794, 795 and 797, and consisted of basaltic sills and lava
flows. These rocks exhibit a broad range in isotopic composition, broader
than that seen in any other western Pacific arc or backarc system:
87Sr / 86Sr = 0.70369 to 0.70499, 143Nd / 144Nd = 0.51267 to 0.51317,
206Pb / 204Pb = 17.64 to 18.36. The samples from highly correlated
arrays between very depleted mid-ocean ridge basalt (MORB) and the
Pacific pelagic sediment fields on Pb - Pb plots. Similarly, on plots
of Sr - Pb and Nd - Pb, the Sea of Japan samples lie on mixing curves
between depleted mantle and enriched mantle ( "EM II" ), which is
interpreted to be of average crustal or pelagic sediment
composition. The source of these backarc rocks appears to be a
MORB-like mantle source, contaminated by pelagic sediments"
( Tamaki et al., 1992 ).
The 40Ar - 39Ar absolute ages
of basaltic rocks are 17 - 24 Ma at site
795, 20 - 21 Ma at site 794, and 18 - 19 Ma at site 797. It conveys the suggestion
that the crust is young in a southward direction. Variations in chemical compositions
and melting experiments suggest that the basin volcanism results
from seafloor spreading or a continental rifting processes
( Tamaki et al., 1992 ).
The Sea of Japan is one of the geologically best - studied
marginal seas of the Pacific. It allowed I.I. Bersenev to compile a
geological map of the sea at a scale of 1 : 2500000
( Bersenev et al., 1987 ).
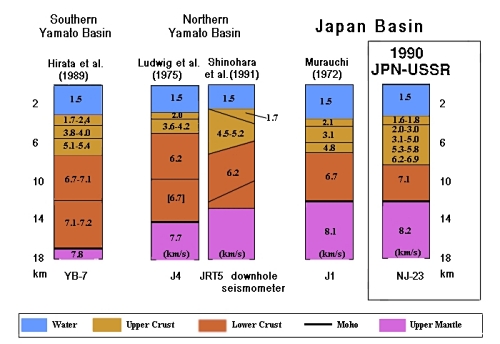
The thickness of the crust of the Sea of Japan is 12 - 16 km
( Hirata et al., 1992;
Hirata and Kurashimo, 1995 ).
Seismic Structure of the Japan Basin
( from Hirata et al., 1992 )
In the lower part of the crust,
Pre-Cambrian metamorphic rocks participate that were formed in
granulite and amphibolite facies of the regional metamorphism under
temperatures of 600 - 800 o C
( Bersenev et al., 1987 ).
The sedimentary basin from dredging and deep-sea drilling data
( Tamaki et al., 1992 )
is composed of marine Neogene and Quaternary sediments saturated
with volcanic matter.
Below the crust in the mantle of the Sea of Japan the
asthenosphere is revealed by seismical and geothermal research.
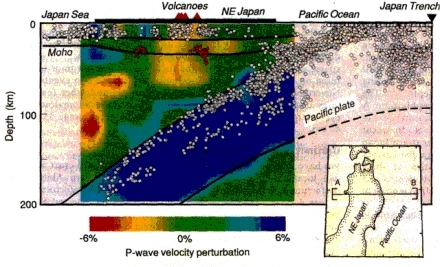
Tomographic inversions of P- wave
( Hasegawa et al., 1991 )
show low-velocity zones distributed in the crust and upper mantle
beneath active volcanoes of Japan Island Arc and Japan Sea.
 |
 |
|
East-west
vertical cross-section of fractional P-wave
velocity perturbation (in %) along the line AB in the inset map.
Open circles are microearthquakes within a 60-km width along AB located
by the seismic network of Tohoku University in 1987-1990.
The land area and active volcanoes are shown at the top of the figure
by the bold horizontal line and red triangles, respectively. The depth
distributions of the Conrad and Moho discontinuities and the top of the
subducted Pacific plate are fixed in the inversion, and are shown by
bold lines. The estimated location of the bottom of the Pacific plate
is also shown by a bold line.
|
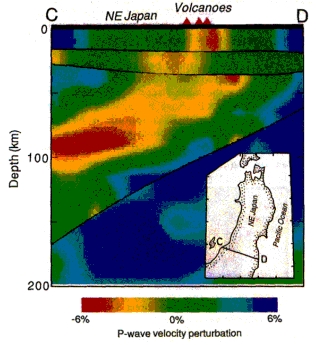
Vertical cross-section of fractional P-wave velocity
perturbation along the line CD in the inset map.
|
The studies of the structure of the Sea of Japan from gravimetric
and seismic data
( Boldyrev et al., 1993 )
revealed an anomalously thinned upper mantle under the deep-sea basin .
Geodynamic Profile across Sikhote-Alin - Japan Sea - Pacific
Ocean
( from Boldyrev et al.,
1993 )
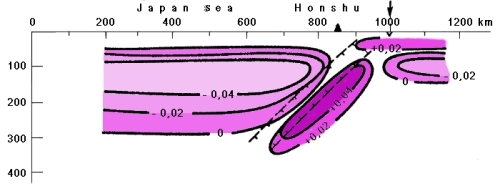 Distribution
of Density Anomalies (g / cm3)
Distribution
of Density Anomalies (g / cm3)
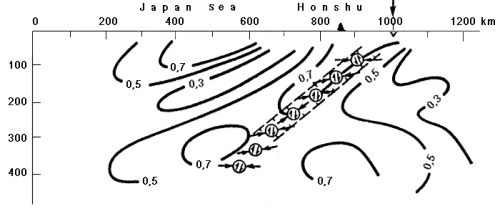 Isolines
of maximal shears ( kb ).
Isolines
of maximal shears ( kb ).
Arrows show direction of major compressive stresses in the seismic focal
zone,
in circles fault displacement is shown
Strains appearing on the border of blocks of different density show
that the area of maximal values of shift deformations coincides with
the location of seismofocal zone
( Boldyrev et al., 1993 ).
The study of fine structure of seismicity in subduction
zone of Japan region was made by
Vadkovsky, 1997 .
Under detailed study of Japan region seismicity from data of the Japan
Meteorological Agency (JMA) earthquake catalogue for the
period of 1983-1996 the so-called "nails" were detected. The "nails" are
narrow, isometrical on plane, oriented near vertical, compact
and very shortlived buildups of earthquake hypocentres. Their length
comes from 15 to 30 km in depth and they exist during a period from some
days to one month.
The direct correlation of "nails" with any aftershocks
of strong earthquakes with magnitudes MbJMA >5.0 and with
recent active volcanoes doesn't exist. Sometimes the strong earthquake
could occur in "nail" body during the process of its formation.
The test on the Markov process in the "nail" formation shows that
a preferable sense of a "nail" growth (upwards or downwards) is absent.
It means that earthquake hypocentres fill the "nail" body with
equal probabilities on any depth in the process of its forming.
The 3-D Distribution of Earthquake Hypocenters in the
Seismofocal Zone near Hokkaido Island
The magnitude distribution is shown at the top right of the
figure.
The depth distribution with the step of 1km - on the lower left.
The sloping situation of hypocenters zone to a depth of more than
300 km and the shapeless "clouds" of hypocenters to a depth of 60 km are
distinctly visible. The latter corresponds to the hanging wedge of the crust
and upper mantle above slab. It is in this shapeless range that the formation
of "nails" have been fixed.
The Position of "Nails" formed in January-March
1989 near Hokkaido Island in Two Projections Rotated One to Another on 90 Degrees
The "nails" in both projections are vertically oriented
on depths of 0-30 and 20-50 km.
The momentary "nails" formation suggests that fluid dynamics
processes play role in the hanging wedge of the crust and mantle beneath
Japan arc. (For more detailed click here)
The history of the geodynamic development of the lithosphere of
the Sea of Japan can be presented on the basis of the combined
interpretation of geological and geophysical data as follows
( Ingle, 1992 ) .
"Initial rifting, extension, and thermal subsidence in the Japan
Sea region commenced in late Oligocene time (ca. 32 - 35 Ma) at rates
of < 150 m / m. y. accompanied by widespread deposition of non-marine
sediment and volcanic units and probable early spreading in the Japan Basin.
A period of accelerating subsidence (100 - 500 m / m. y.), backarc
spreading, rift propagation, massive basaltic magmatism, and crustal
extension began in the early Miocene ca. 24 - 23 Ma culminating in
subsidence of the Japan, Yamato, and Tsushima basins to near their
present depths (2 - 3 km) by 20 - 18 Ma.
Slow subsidence persisted
from 18 Ma to 16 - 15 Ma when a second episode of rapid subsidence
occurred as rifts propagated into the arc, arc-flanks, and other
areas of weakened continental crust around the perimeter of the sea
creating numerous sub-basins accompanied by middle Miocene rotation
of southwest Japan and a second pulse of basaltic magmatism.
Maximum
rates of tectonic subsidence during middle Miocene sub-basin
formation exceeded 900 m / m. y. pointing to a pull-apart origin for
these features which were initially sediment-starved and filled with
pelagic and hemipelagic diatomaceous muds. Relatively low rates of
subsidence (< 200 m / m. y.) characterize the tectonic quiescent
middle-late Miocene stage in the evolution of the sea from 12.5 to
10 Ma.
Evidence of initial regional uplift (10 - 100 m / m. y.) appears
in the southern Japan Sea ca. 11 - 10 Ma with compressional uplift
and destruction of Miocene sub-basins in arc and arc-flank areas of
Honshu, Hokkaido, and Sakhalin ca. 5 Ma. Rates of uplift
subsequently accelerated to 500 - 1500 m / m. y. in Late Pliocene and
Pleistocene time (2.0 - 0.7 Ma) resulting in widespread deformation
of pre-upper Pleistocene sedimentary sequences and the tectonic
reorganization of the eastern, central, and southern Japan Sea
creating the borderland-style topography now characterizing these
areas".
The island arc of Japan frames the Sea of
Japan in the southeast and is located at the junction of four
lithospheric plates: the Eurasia, the Pacific, the Philippine Sea and
the Okhotsk Sea (or North American) plates.
Tectonic Map of the Modern Japanese Islands
( from Maruyama et al., 1997 )
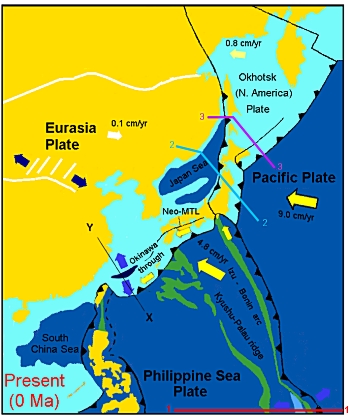
Three active arc-trench systems develop in Southwest Japan-Ryukyu,
Northeast Japan, and Izu-Bonin. The oblique subduction of the Philippine
Sea Plate generated fore-arc slivers along the Southwest Japan-Ryukyu Arc.
Note that the linear neo-Median Tectonic Line (neo-MTL) cutting the
low-angle paleo-MTL corresponds to the landward margin of the fore-arc
sliver in Southwest Japan. Another back-arc basin, the Okinawa Trough,
is opening in the Ryukyu with hydrothermal activity. The question of
whether the Okhotsk Plate recently became independent from the North
America Plate is still debated.
In the Sea of Japan the spreading centers were recorded in the
Japan basin
( Isezaki et al., 1976 )
that were active, as presumed by
( Maruyama et al., 1997 )
25 - 15 Ma ago, but were apparently reactivated in recent time.
Meanwhile, a new subduction structure is supposed to be formed in
the eastern area of the deep basin of the Sea of Japan along the western
coast of Hokkaido and northern end of Honshu
( Uyeda, 1991 ) .
Spatial Distribution of Earthquake Hypocenters
with Depth in the Range of 0 to 200 km on Evidence from the Japan Meteorological
Agency Earthquake Catalogue for the Period from 1983 to 1999
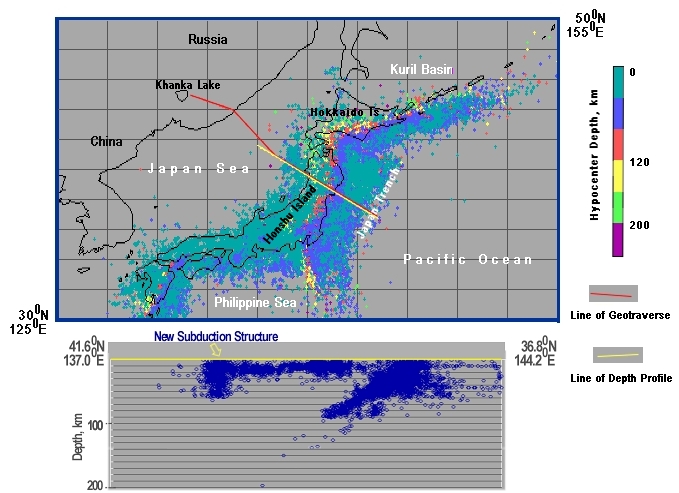
The depth distribution of 10417 earthquake hypocenters along the profile
with width 1o in the right part of the geotraverse.
The concentration of the earthquake foci in the west part of section
goes downwards under Hokkaido and northern area of Honshu forming new
structure zone.
A complicated submarine topography was revealed in this part of traverse.
Along the coast the submarine Okushiri Ridge is located that separates
the deep basin of the Sea of Japan from the trough (Okushiri Basin),
composed of sediments
( Honza, 1979 ) .
Parallel to the submarine Okushiri Ridge a band of earthquakes is noted
that forms a seismofocal zone subsiding under the Japan Island Arc
( Kuge et al., 1996 ) .
Topography and Seismic Profile in the East
Part of Japan Basin,
New Subduction Zone (from Honza, 1979
)
The formation of compression ridge (underwater Okushiri Ridge),
sedimentary trough tension fissures, turbidity flows
sediments, scarps and other topography form dislocations are related
to the new subduction zone. The Okushiro Ridge is believed to have
formed as a result of the oceanic crust compression and upthrusting 1.8
million years ago
( Rangin et al., 1995
Okano et al., 1995 ) .
URL:
http://www.wdcb.ru/sep/traverses/Japan_Geotraverse/text.html
2001-2016 © WDC for SEP,
GC RAS
webmaster
|